 Rimani
Condizioni di trading
Strumenti


The GBP/USD pair also experienced a strong rally on Monday. However, from a technical standpoint, this movement was more justified than for the euro. Unlike the euro, the British pound remains in an uptrend and has not broken below its trendline. There were virtually no macroeconomic reasons for the pound's rally on Monday. The UK Manufacturing PMI was published as a second estimate, while the first significant report—the ISM index—was released in the evening after the market had already moved higher. The dollar began to weaken overnight, making the move largely an emotional reaction to Friday's events at the White House. It is unclear why the market interpreted these events negatively for the dollar, but Trump's presidency has shown that he only supports "world peace" in words. In reality, he is engaging in conflicts with half the world, imposing his conditions, which makes traders wary of the dollar.
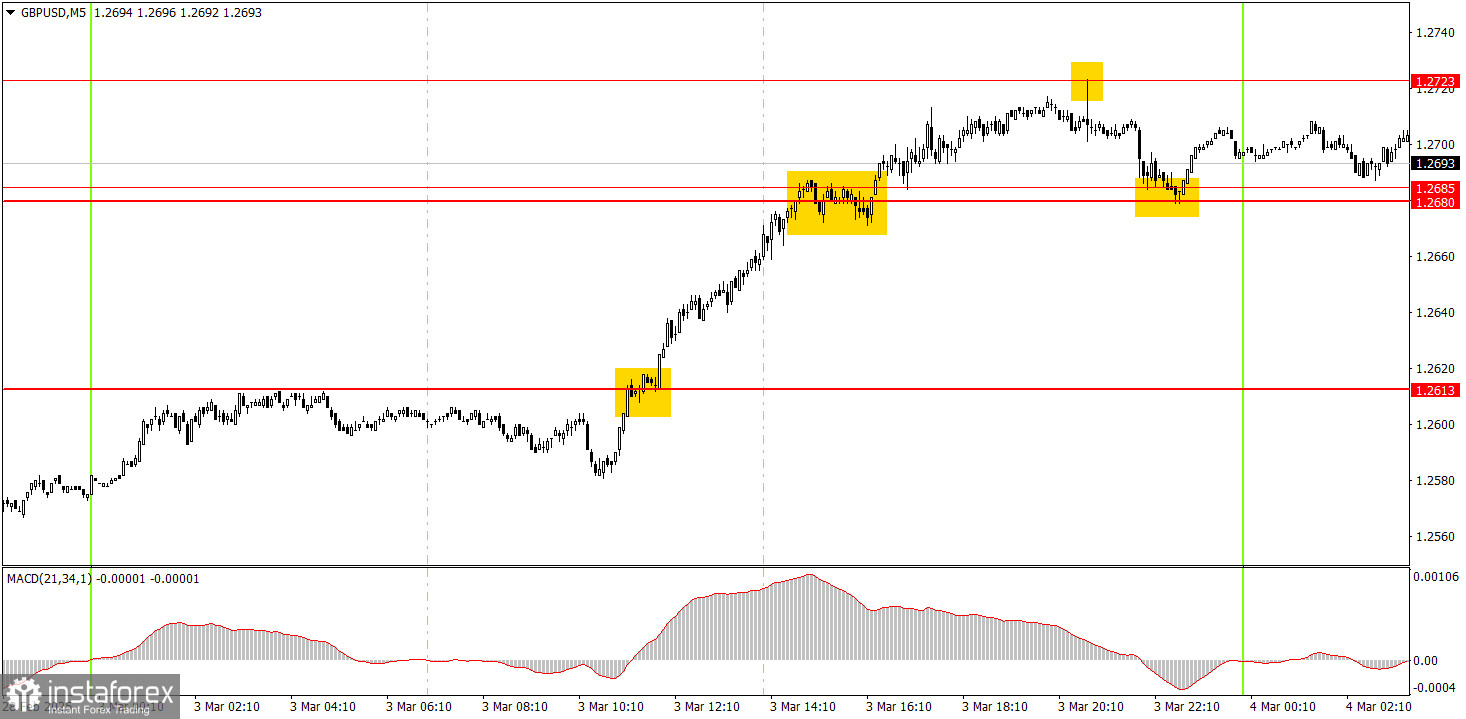
The 5-minute chart of GBP/USD shows that multiple trading signals were generated on Monday. The pair first broke above the 1.2613 level and then continued moving higher. The 1.2680-1.2685 area was breached, and the price tested the 1.2723 level. The upward movement ended around this level, providing an opportunity to close long positions with a profit of at least 80 pips.
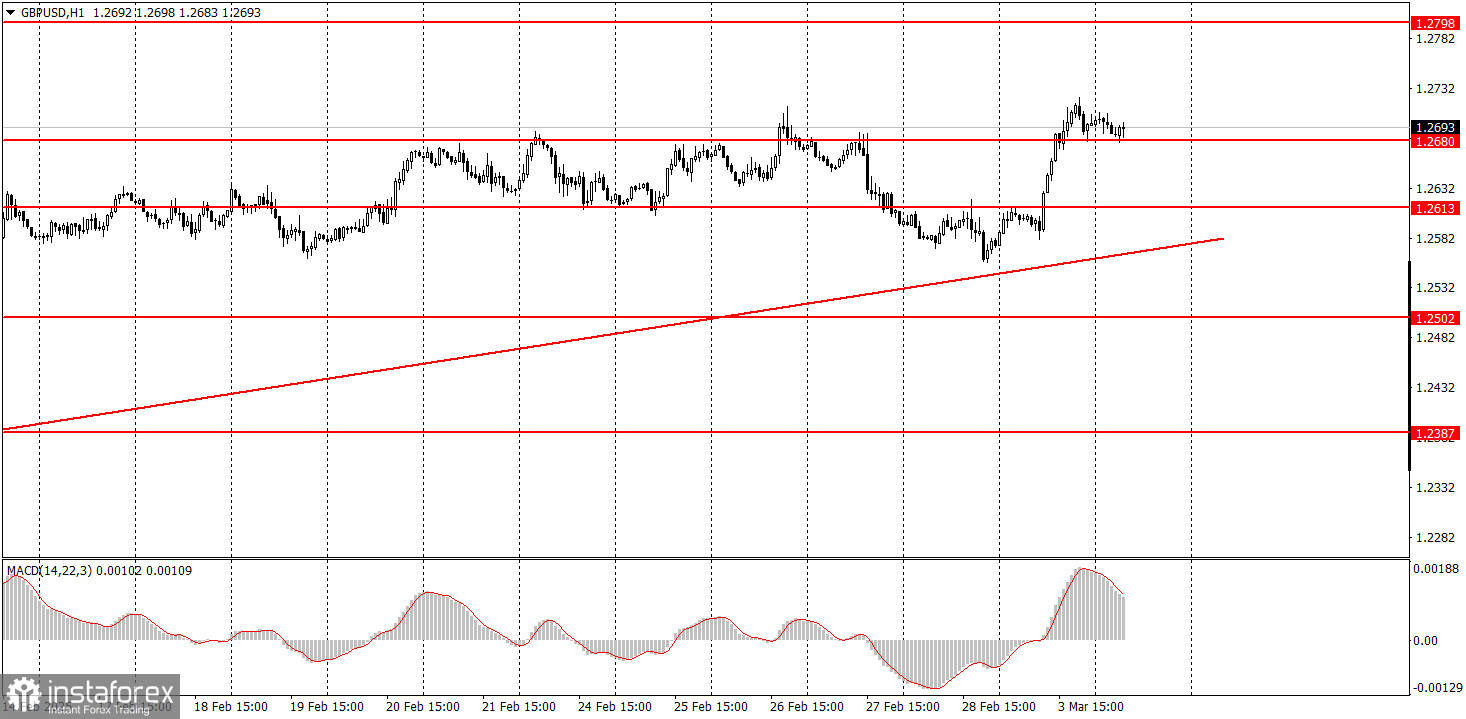
In the hourly timeframe, GBP/USD may begin a short-term downtrend, while the recent week's movements represent a correction in the daily chart. In the medium term, we still expect the pound to decline towards 1.1800, which remains the most logical scenario. The key now is to wait for the completion of the upward correction on the daily chart and for the price to consolidate below the trendline on the hourly chart.
On Tuesday, GBP/USD could continue rising if Trump keeps creating chaos and imposing his terms on the global stage. No macroeconomic reports are scheduled for today, and the pound has been rising almost without reason.
On the 5-minute timeframe, key levels for trading include 1.2164-1.2170, 1.2241-1.2270, 1.2301, 1.2372-1.2387, 1.2445, 1.2502-1.2508, 1.2547, 1.2613, 1.2680-1.2685, 1.2723, and 1.2791-1.2798. No major reports are scheduled for the UK or the U.S. on Tuesday, but another speech from Donald Trump is expected in the evening. Given that he just imposed additional tariffs on China, the market is unlikely to be dull this week.
Support and Resistance Levels: These are target levels for opening or closing positions and can also serve as points for placing Take Profit orders.
Red Lines: Channels or trendlines indicating the current trend and the preferred direction for trading.
MACD Indicator (14,22,3): A histogram and signal line used as a supplementary source of trading signals.
Important Events and Reports: Found in the economic calendar, these can heavily influence price movements. Exercise caution or exit the market during their release to avoid sharp reversals.
Forex trading beginners should remember that not every trade will be profitable. Developing a clear strategy and practicing proper money management are essential for long-term trading success.
Le recensioni analitiche di InstaForex ti renderanno pienamente consapevole delle tendenze del mercato! Essendo un cliente InstaForex, ti viene fornito un gran numero di servizi gratuiti per il trading efficiente.


