 Rimani
Condizioni di trading
Strumenti


The EUR/USD currency pair resumed its upward movement on Tuesday after a two-day pause, gaining another 100 points. Notably, the macroeconomic backdrop did not contribute to the recent decline of the U.S. dollar. The only report released that day, concerning JOLTs job openings, was deemed irrelevant by traders from the outset. Despite coming in above expectations, the data had no effect on the dollar's downturn.
It cannot be said that Donald Trump was the primary catalyst for the dollar selloff on Tuesday. Instead, the market had remained stagnant for two days, took a breather, and observed that Trump had no intention of softening his rhetoric. As a result, traders continued to offload the U.S. currency aggressively. The U.S. stock market is also continuing to decline, with shares of Elon Musk's companies plummeting at an alarming rate, paralleling Tesla's falling electric vehicle sales. Nevertheless, Trump can still be held accountable for this situation; he expressed dissatisfaction when Canada, under its new Prime Minister Mark Carney, declined to become the 51st U.S. state and began imposing retaliatory sanctions and tariffs against the U.S. In response, Trump swiftly introduced additional tariffs on Canadian steel and aluminum and threatened to tax lumber as well— a familiar approach for him.
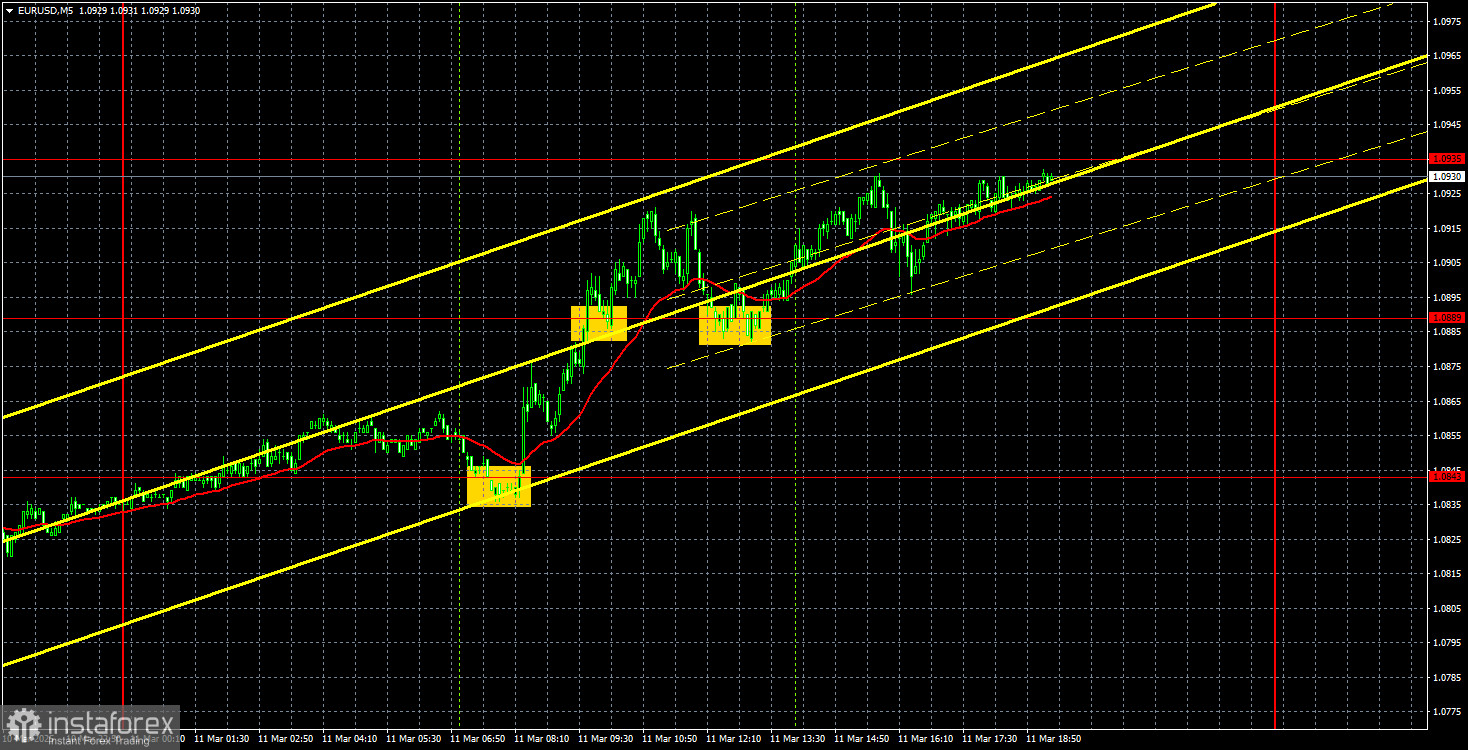
Tuesday's trading signals showed an inaccurate bounce from the 1.0843 level, a breakout at 1.0889, and another inaccurate bounce at the same level. Ultimately, the final target of 1.0935 was reached by the end of the day, indicating that all trading signals turned out to be profitable. However, it is important to note that technical analysis is of little significance to traders at the moment, as market participants continue to sell the dollar regardless of levels, trend lines, or patterns.
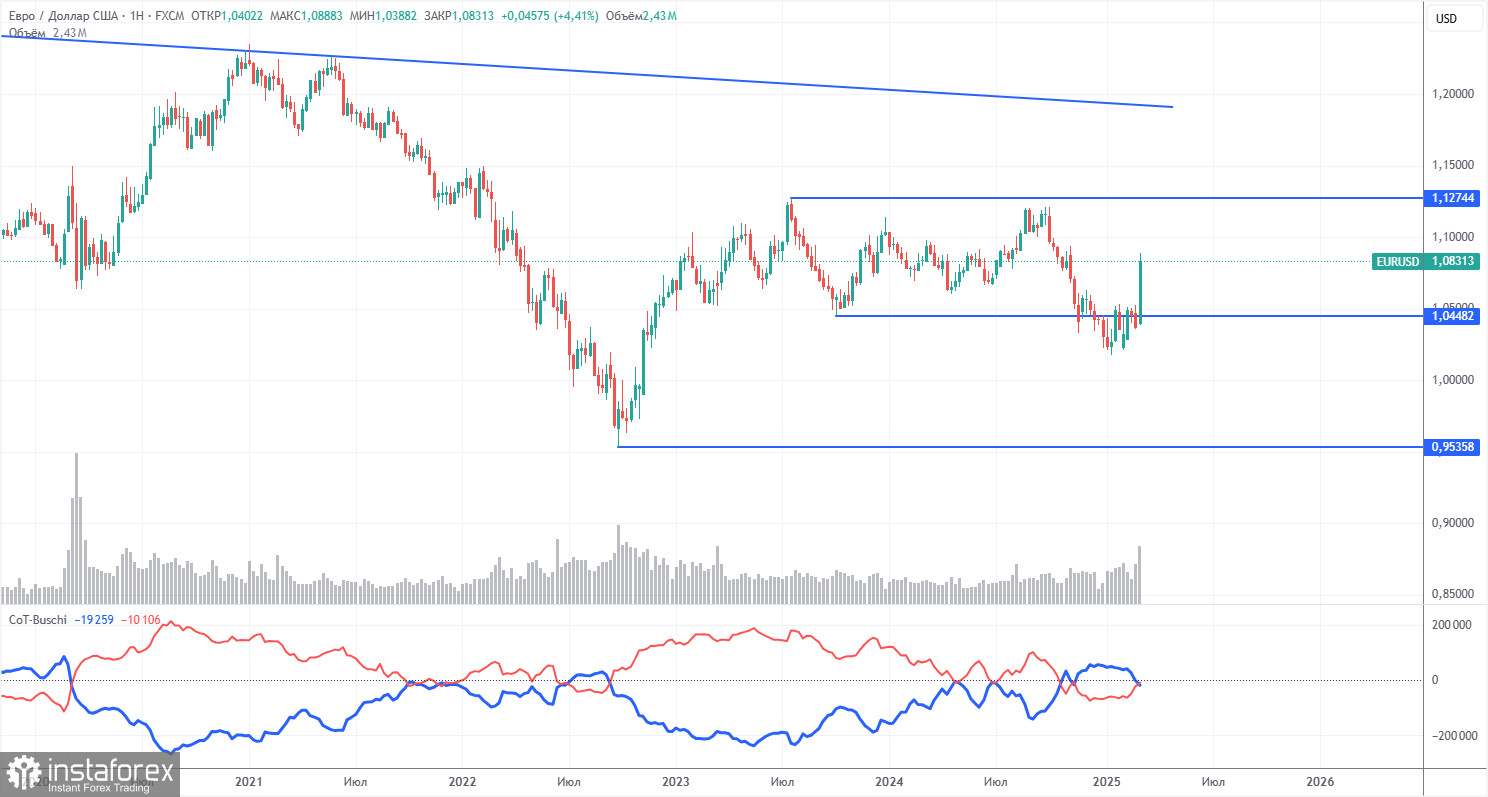
The latest Commitment of Traders (COT) report is dated March 4. The illustration above clearly shows that the net position of non-commercial traders has remained bullish for an extended period; however, bears have recently gained the upper hand. Four months ago, the number of open short positions held by professional traders sharply increased, causing the net position to turn negative for the first time in a long time. This indicates that the euro is now being sold more frequently than it is being bought. Nevertheless, the advantage of the bears is quickly diminishing following Trump taking office as the U.S. president.
Currently, we do not observe any fundamental factors that would support a strengthening of the euro. However, one significant factor has emerged that is contributing to the decline of the U.S. dollar. It is possible that the pair will continue to correct for several more weeks or months, but the 16-year downtrend is unlikely to reverse quickly.
At this point, the red and blue lines have crossed again, indicating that the market trend is now neutral. During the last reporting week, the number of long positions in the "non-commercial" group increased by 2,500, while the number of short positions decreased by 12,800. As a result, the net position increased by another 15,300 contracts.
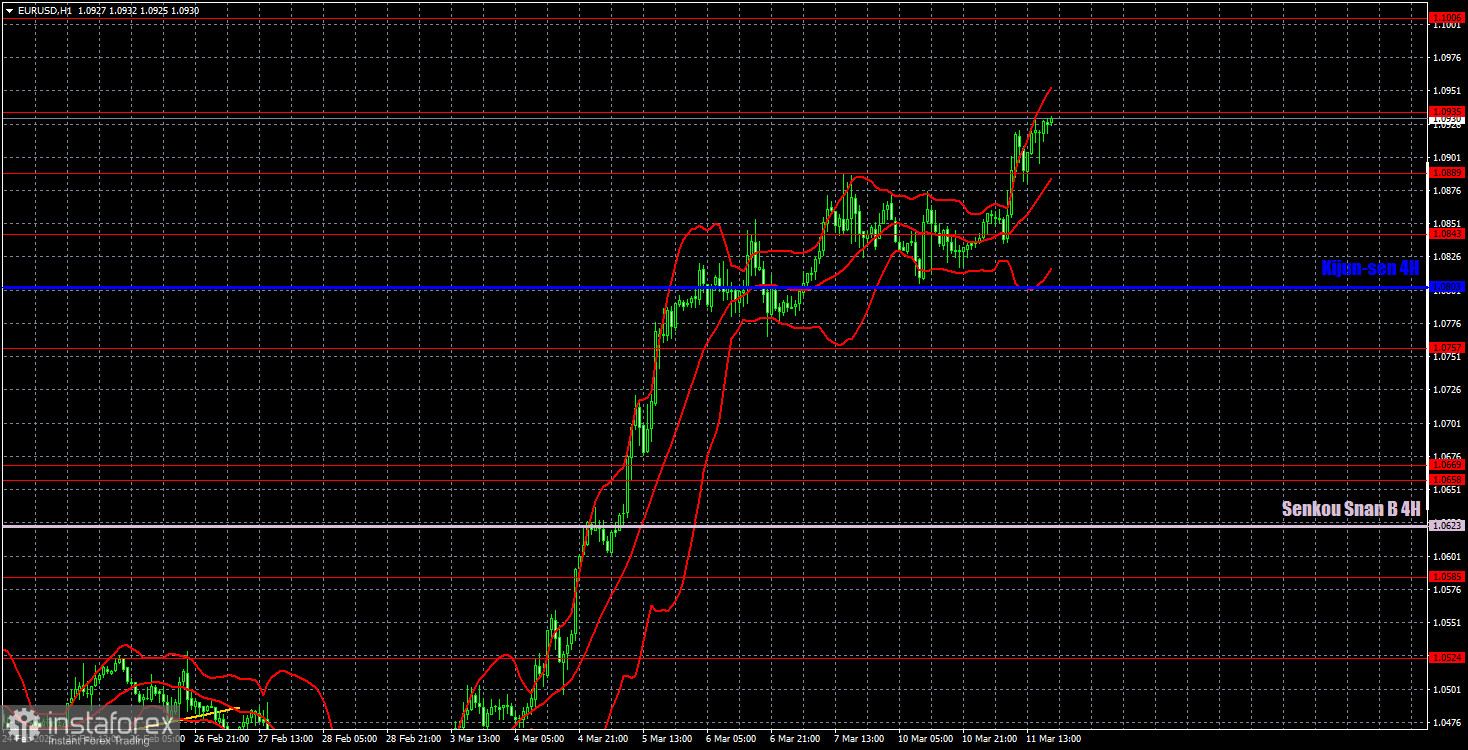
In the hourly time frame, the price continues its meteoric rise. A decline will likely resume in the medium term due to differences in monetary policy between the ECB and the Fed, but it is unclear how long the market will continue reacting to the Trump factor. The current movement is pure market panic, and where it will take the pair remains unknown. Traders ignore everything except Donald Trump's statements, and the dollar is being sold at any price. The movement is almost vertical.
For March 12, we highlight the following trading levels: 1.0340-1.0366, 1.0461, 1.0524, 1.0585, 1.0658-1.0669, 1.0757, 1.0797, 1.0843, 1.0889, 1.0935, 1.1006, 1.1092, along with the Senkou Span B line (1.0803) and the Kijun-sen line (1.0623). The Ichimoku indicator lines may shift during the day, which should be taken into account when identifying trading signals. Don't forget to set a Stop Loss at breakeven if the price moves 15 points in the right direction—this will protect against potential losses if a signal turns out to be false.
On Wednesday, the U.S. will release its February inflation report, while ECB President Christine Lagarde will speak in the Eurozone. If inflation slows more than expected, the dollar may drop again. If inflation comes in higher than expected, the dollar might see only a minor strengthening. However, it's important to remember that Trump alone is moving the market right now.
Le recensioni analitiche di InstaForex ti renderanno pienamente consapevole delle tendenze del mercato! Essendo un cliente InstaForex, ti viene fornito un gran numero di servizi gratuiti per il trading efficiente.


