empty
 
 
Stai per lasciare
www.instaforex.eu >
il sito gestito da
INSTANT TRADING EU LTD
Apri un conto

24.03.202514:22 Forex Analysis & Reviews: Weekly Technical Analysis for March 24–29: EUR/USD Currency Pair

Queste informazioni sono fornite ai clienti al dettaglio e professionisti come parte della comunicazione di marketing. Non contiene e non deve essere interpretata come contenente consigli di investimento o raccomandazioni di investimento o un'offerta o una sollecitazione a impegnarsi in qualsiasi transazione o strategia in strumenti finanziari. Le performance passate non sono una garanzia o una previsione delle performance future. Instant Trading EU Ltd. non rilascia alcuna dichiarazione e non si assume alcuna responsabilità in merito all'accuratezza o completezza delle informazioni fornite, o qualsiasi perdita derivante da qualsiasi investimento basato su analisi, previsioni o altre informazioni fornite da un dipendente della Società o altri. Il disclaimer completo è disponibile qui.

Trend Analysis (Fig. 1)

This week, the market may start moving upward from the level of 1.0815 (closing of the last weekly candle), targeting 1.0957 – the upper fractal (blue dashed line). Upon testing this level, the price may continue rising toward 1.1002 – the historical resistance level (light blue dashed line).

Exchange Rates 24.03.2025 analysis

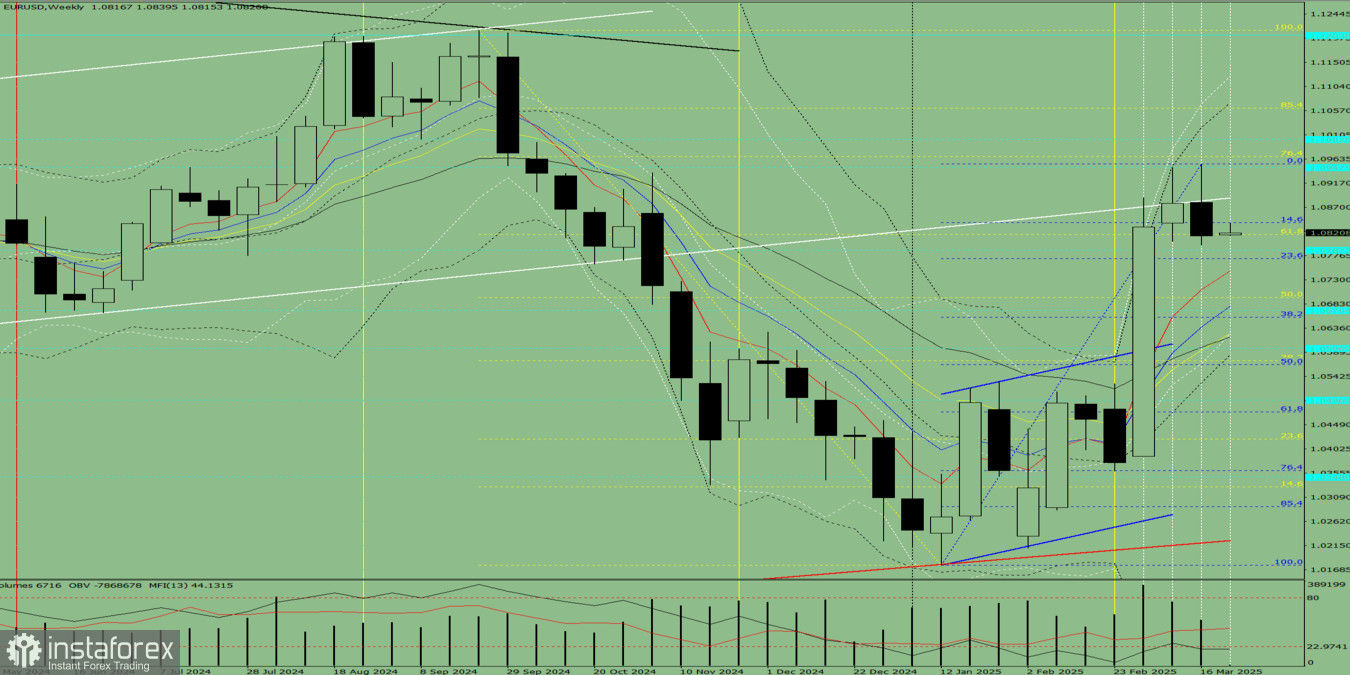
Fig. 1 (Weekly Chart)

Comprehensive Analysis:

  • Indicator analysis – upward
  • Fibonacci levels – upward
  • Volume – upward
  • Candlestick analysis – upward
  • Trend analysis – upward
  • Bollinger Bands – upward
  • Monthly chart – upward

Conclusion based on the comprehensive analysis: upward movement.

Overall forecast for the EUR/USD weekly candle: the price will most likely show an upward trend throughout the week, with no lower shadow on the weekly white candle (Monday – upward movement) and a potential upper shadow (Friday – pullback).

Alternative scenario: the pair may start moving upward from the level of 1.0815 (closing of the last weekly candle), targeting 1.0957 – the upper fractal (blue dashed line). Upon testing this level, the price may pull back downward to 1.0890 – resistance line (bold white line).

Eseguito da Stefan Doll
Esperto analista di InstaForex
© 2007-2025

Apri un conto di trading

Le recensioni analitiche di InstaForex ti renderanno pienamente consapevole delle tendenze del mercato! Essendo un cliente InstaForex, ti viene fornito un gran numero di servizi gratuiti per il trading efficiente.


Stai per lasciare www.instaforex.eu, il sito Web gestito da INSTANT TRADING EU LTD
In questo momento non potete parlare al telefono?
Ponete la vostra domanda nella chat.
Widget callback

Turn "Do Not Track" off