 Rimani
Condizioni di trading
Strumenti


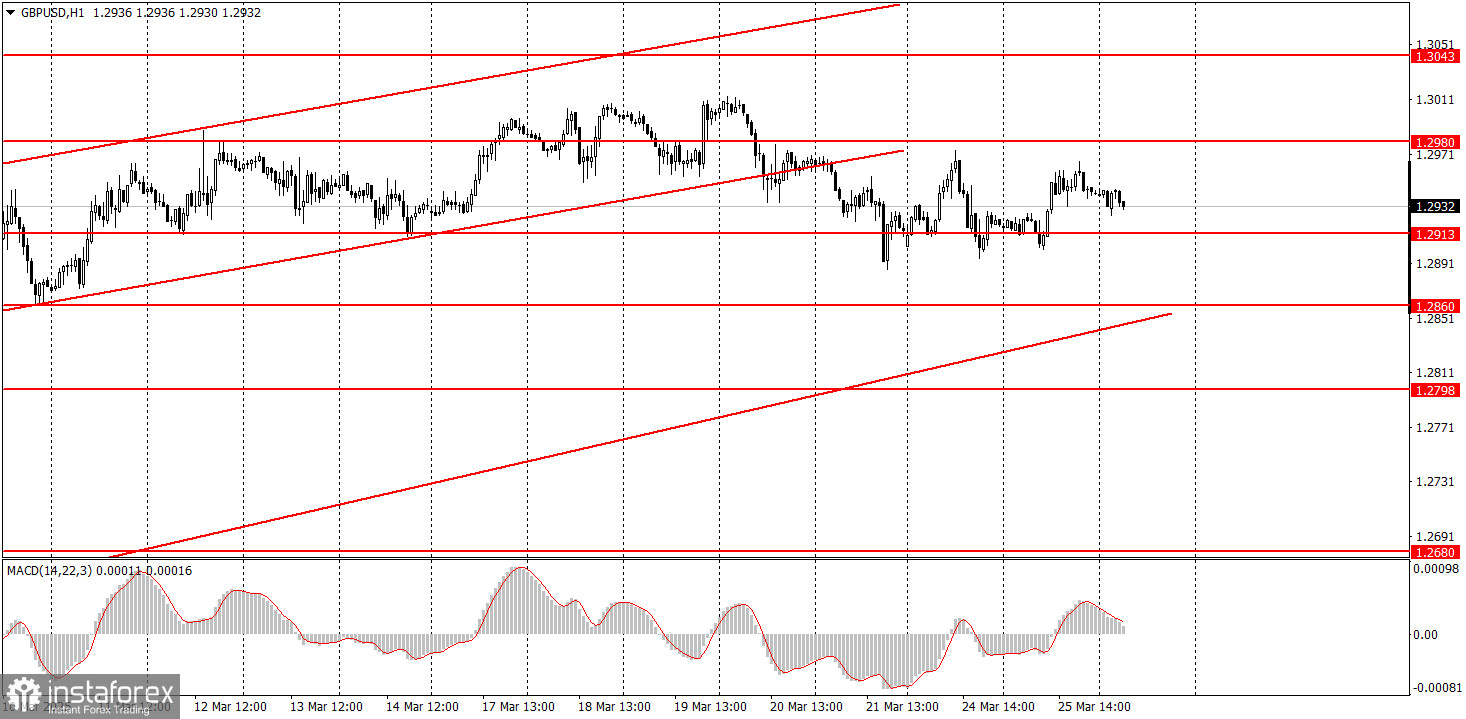
On Tuesday, the GBP/USD pair traded with a slight increase, but the overall movement of recent weeks increasingly resembles a flat market. The assumed sideways channel has no clearly defined boundaries, but the chart shows that the price moves sideways. As a result, the price rose yesterday without any particular reason, and today, it may just as easily fall. The uptrend is in place, as indicated by the ascending trendline. Therefore, a resumption of the British pound's growth is possible, even though there are no valid reasons for it apart from Donald Trump. However, if the market only considers that factor, what's the point of denying the move? No significant reports were released in the U.S. or the UK yesterday, so there is nothing to analyze fundamentally.
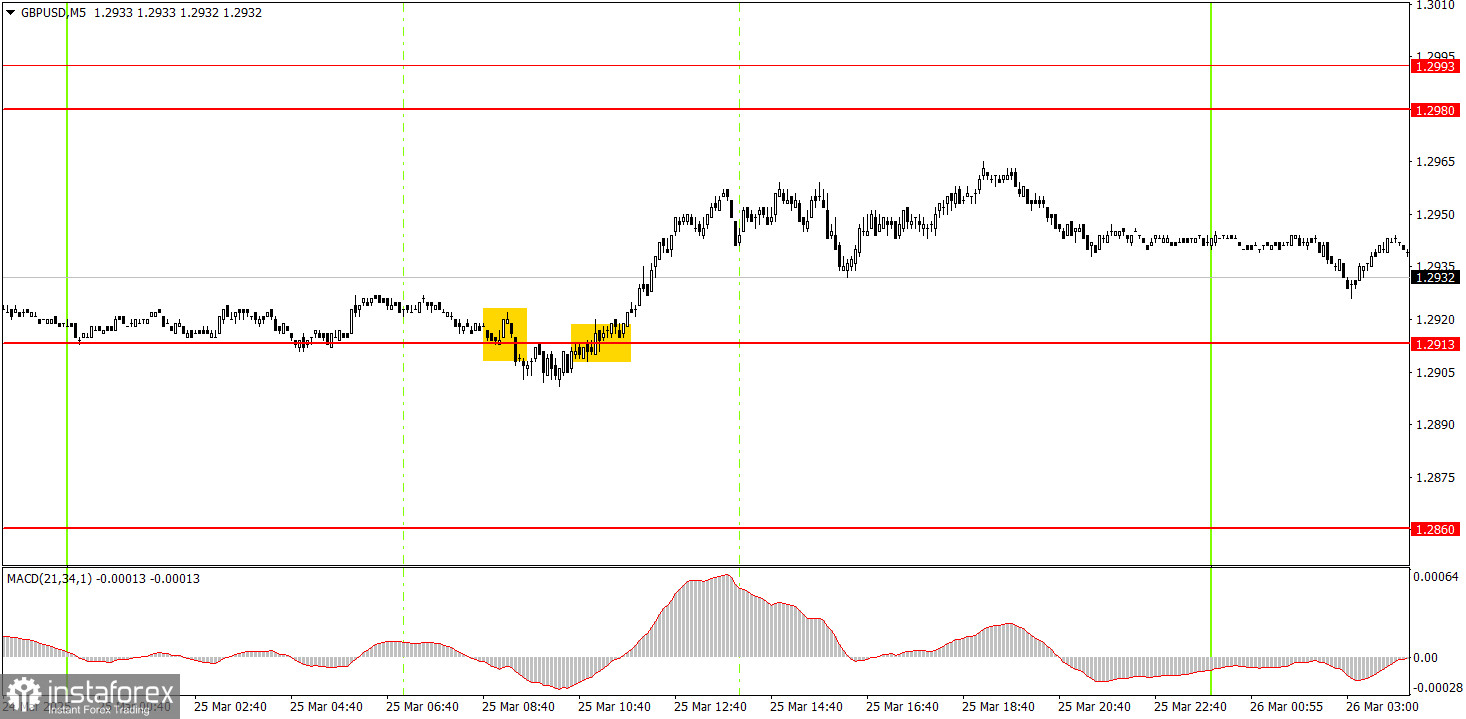
On the 5-minute timeframe, two trading signals were formed on Tuesday near the 1.2913 level. Let's recall that this is not the most important or strongest level, and the price has been moving sideways for several weeks. Any levels or lines can be easily ignored within such a sideways movement. Nevertheless, while the first sell signal was false, the second buy signal was successful. The first signal resulted in a small loss for novice traders, but the second brought a profit of about 25–30 pips.
On the hourly timeframe, the GBP/USD pair should have started a downtrend long ago, but Trump is doing everything to prevent that. In the medium term, we still expect the pound to fall with a target of 1.1800. However, it's unclear how long the dollar will continue to collapse "because of Trump." Once this movement ends, the technical picture on all timeframes could change dramatically, but long-term trends still point south. The British pound did not grow without cause, but the growth appeared excessive and irrational once again.
The GBP/USD pair may decline on Wednesday as the hourly chart's technical setup favors that direction. The pound is again overbought and unjustifiably expensive. At the same time, the movement may remain sideways in nature.
On the 5-minute timeframe, the following levels can be used for trading: 1.2301, 1.2372–1.2387, 1.2445, 1.2502–1.2508, 1.2547, 1.2613, 1.2680–1.2685, 1.2723, 1.2791–1.2798, 1.2848–1.2860, 1.2913, 1.2980–1.2993, 1.3043, 1.3102–1.3107. On Wednesday, the UK is scheduled to release the second estimate of February inflation, and in the U.S., a report on durable goods orders will be published. The UK inflation report may provoke a market reaction only if it differs from the first estimate.
Support and Resistance Levels: These are target levels for opening or closing positions and can also serve as points for placing Take Profit orders.
Red Lines: Channels or trendlines indicating the current trend and the preferred direction for trading.
MACD Indicator (14,22,3): A histogram and signal line used as a supplementary source of trading signals.
Important Events and Reports: Found in the economic calendar, these can heavily influence price movements. Exercise caution or exit the market during their release to avoid sharp reversals.
Forex trading beginners should remember that not every trade will be profitable. Developing a clear strategy and practicing proper money management are essential for long-term trading success.
Le recensioni analitiche di InstaForex ti renderanno pienamente consapevole delle tendenze del mercato! Essendo un cliente InstaForex, ti viene fornito un gran numero di servizi gratuiti per il trading efficiente.


