 Rimani
Condizioni di trading
Strumenti


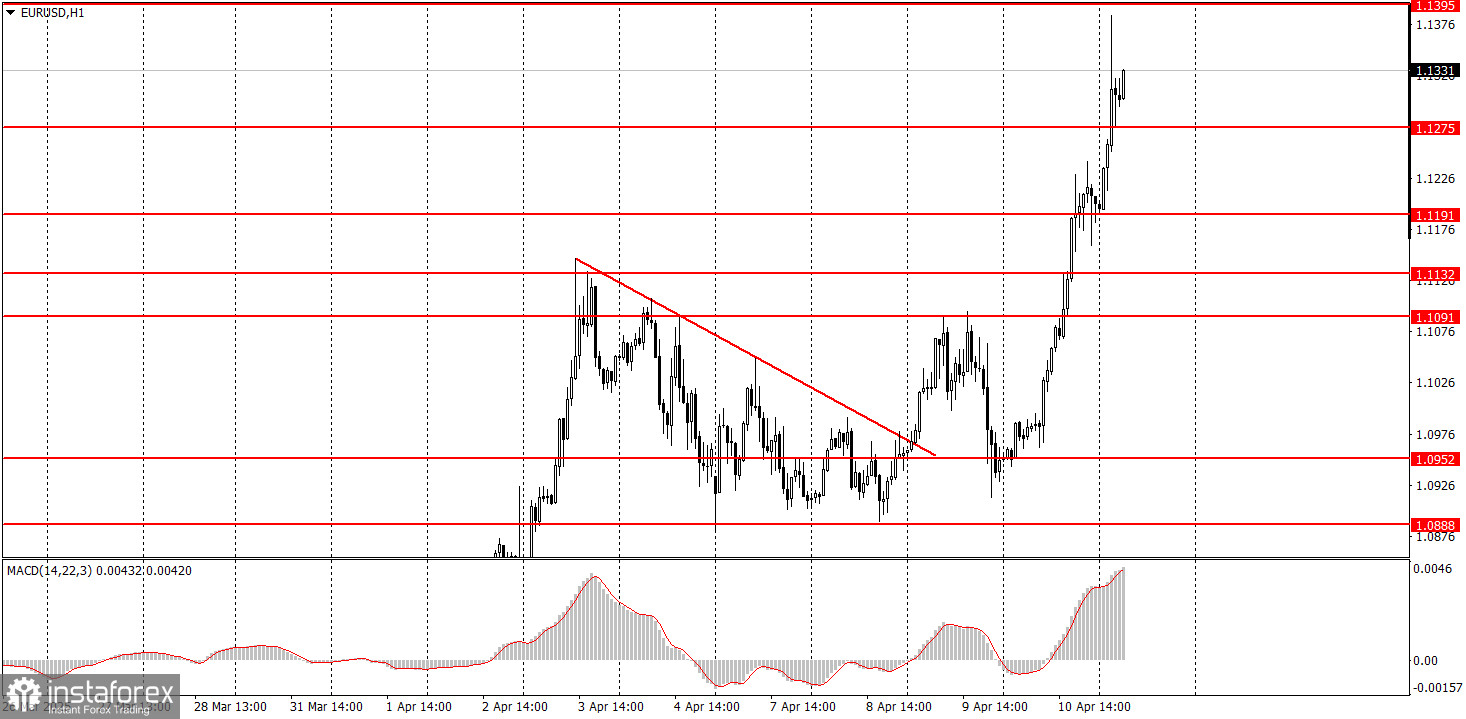
On Thursday, the EUR/USD currency pair resumed its upward movement and posted a gain of more than 300 pips. As Friday began, the pair continued its uninterrupted growth. The reasons behind the new collapse of the U.S. dollar are relatively easy to identify. Donald Trump raised trade tariffs on China, first, by 125%, and later, by 145%. It was this factor that triggered the market reaction. The fact that Trump reduced tariffs to 10% for all other countries drew little attention. Market participants understand that the main standoff is between the U.S. and China—not between the U.S. and Serbia. As a result, most traders are focused on developments involving China (and the EU). The U.S. inflation report, which also came out negative for the dollar, had no real impact. The dollar had already started to plunge before the report's release and continued to do so afterward.
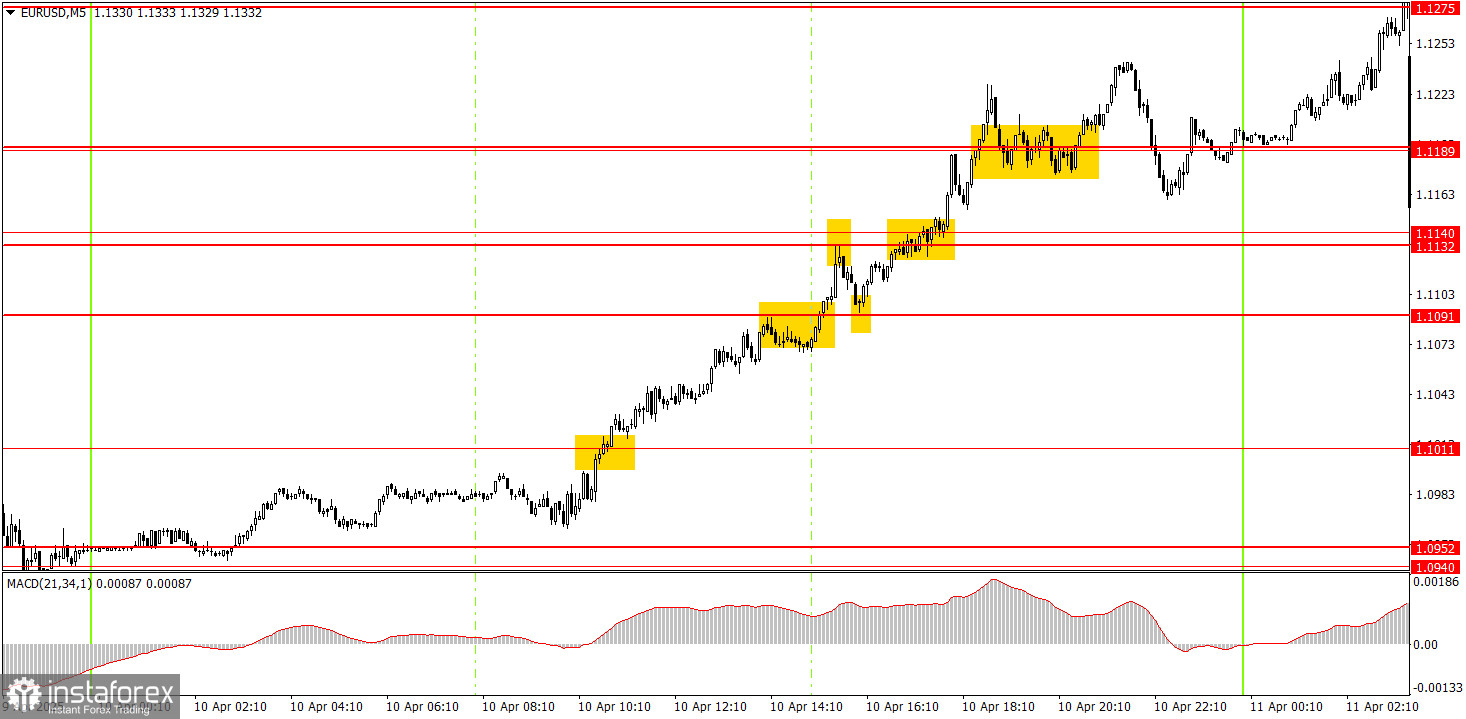
In the 5-minute timeframe, many trading signals were formed on Thursday as the price moved nearly 300 pips in one direction. You could have opened buy trades almost anywhere. You could have closed buy trades almost anywhere. Profit was almost guaranteed in all cases.
On the hourly chart, EUR/USD continues its upward trend. How long this trend will last remains unknown, as no one knows how many more trade tariffs Trump will introduce. Repeated escalations in the trade war are possible, especially since many countries plan to respond to the U.S. with mirrored measures. Trump has already stated that any retaliatory actions will prompt new tariffs from the U.S. Due to these "discounts" from Trump, the dollar could not strengthen since the trade conflict between the U.S. and China is now taking center stage.
Markets will likely remain in a state of shock on Friday. We won't attempt to forecast price movements, as new developments in the trade standoff are being reported almost every two hours. What's currently happening across global markets is extremely difficult to put into words.
In the 5-minute timeframe, the following levels should be considered: 1.0797–1.0804, 1.0859–1.0861, 1.0888–1.0896, 1.0940–1.0952, 1.1011, 1.1091, 1.1132–1.1140, 1.1189–1.1191, 1.1275–1.1292, 1.1330, 1.1367, 1.1395, 1.1418, 1.1449.
On Friday, European Central Bank President Christine Lagarde is scheduled to speak in the Eurozone, and several minor reports will be released in the U.S. We believe the market will continue to react almost exclusively to trade war developments, though Lagarde's remarks could prove significant.
Support and Resistance Levels: These are target levels for opening or closing positions and can also serve as points for placing Take Profit orders.
Red Lines: Channels or trendlines indicating the current trend and the preferred direction for trading.
MACD Indicator (14,22,3): A histogram and signal line used as a supplementary source of trading signals.
Important Events and Reports: Found in the economic calendar, these can heavily influence price movements. Exercise caution or exit the market during their release to avoid sharp reversals.
Forex trading beginners should remember that not every trade will be profitable. Developing a clear strategy and practicing proper money management are essential for long-term trading success.
Le recensioni analitiche di InstaForex ti renderanno pienamente consapevole delle tendenze del mercato! Essendo un cliente InstaForex, ti viene fornito un gran numero di servizi gratuiti per il trading efficiente.


