 Rimani
Condizioni di trading
Strumenti


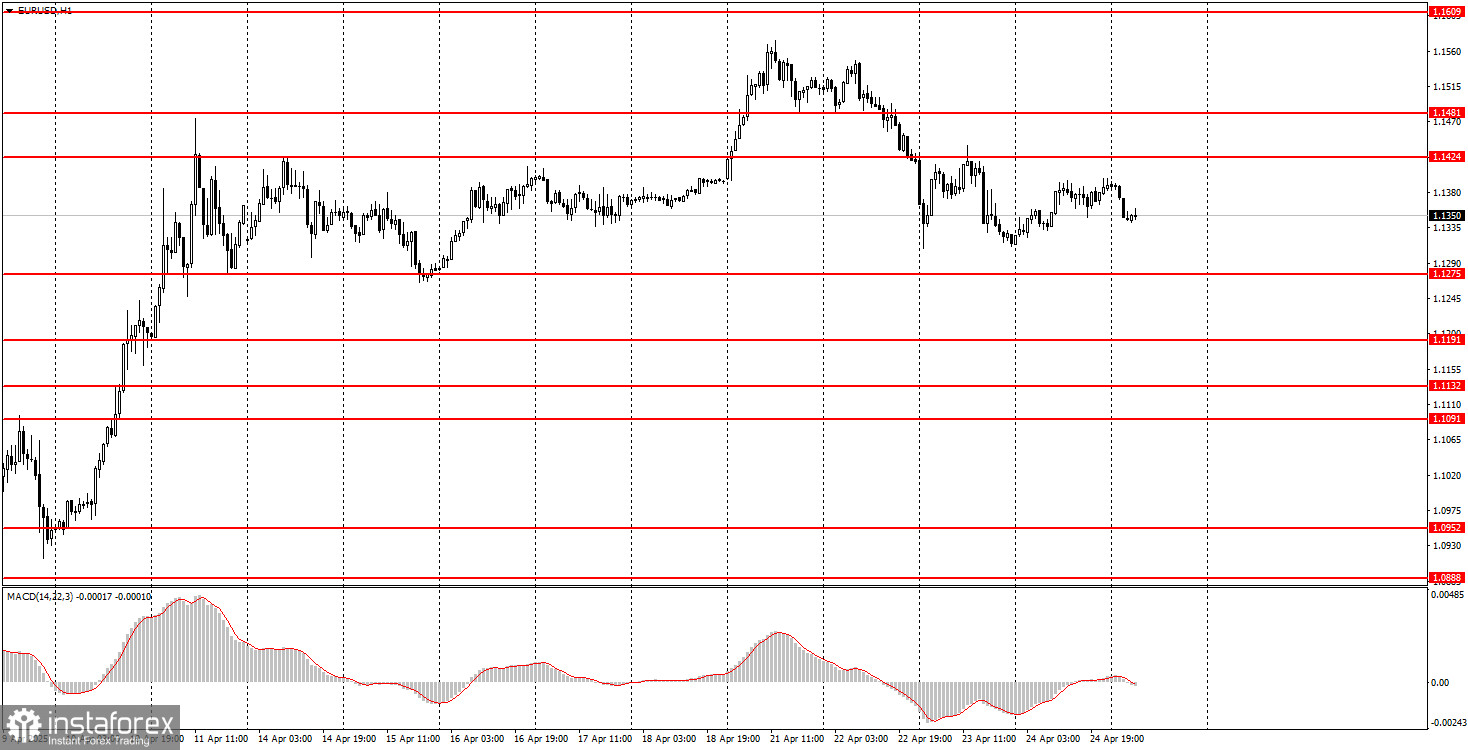
On Thursday, the EUR/USD currency pair traded with a slight upward bias, although it would have been more logical to see a decline in the second half of the day. No significant events, reports, or announcements from Trump in the first half impacted the market. However, a fairly significant report on U.S. durable goods orders was released in the second half, showing a 9.2% increase in March versus a forecast of +2.0%. Did anyone see any market reaction or dollar strength? It's a rhetorical question, and the answer confirms that the market currently pays no attention to macroeconomic data. The dollar began to strengthen overnight, but overall, the pair has returned to the sideways channel of 1.1275–1.1424 established earlier in the week. Thus, the dollar may rise freely to 1.1275, but further growth raises serious doubts.
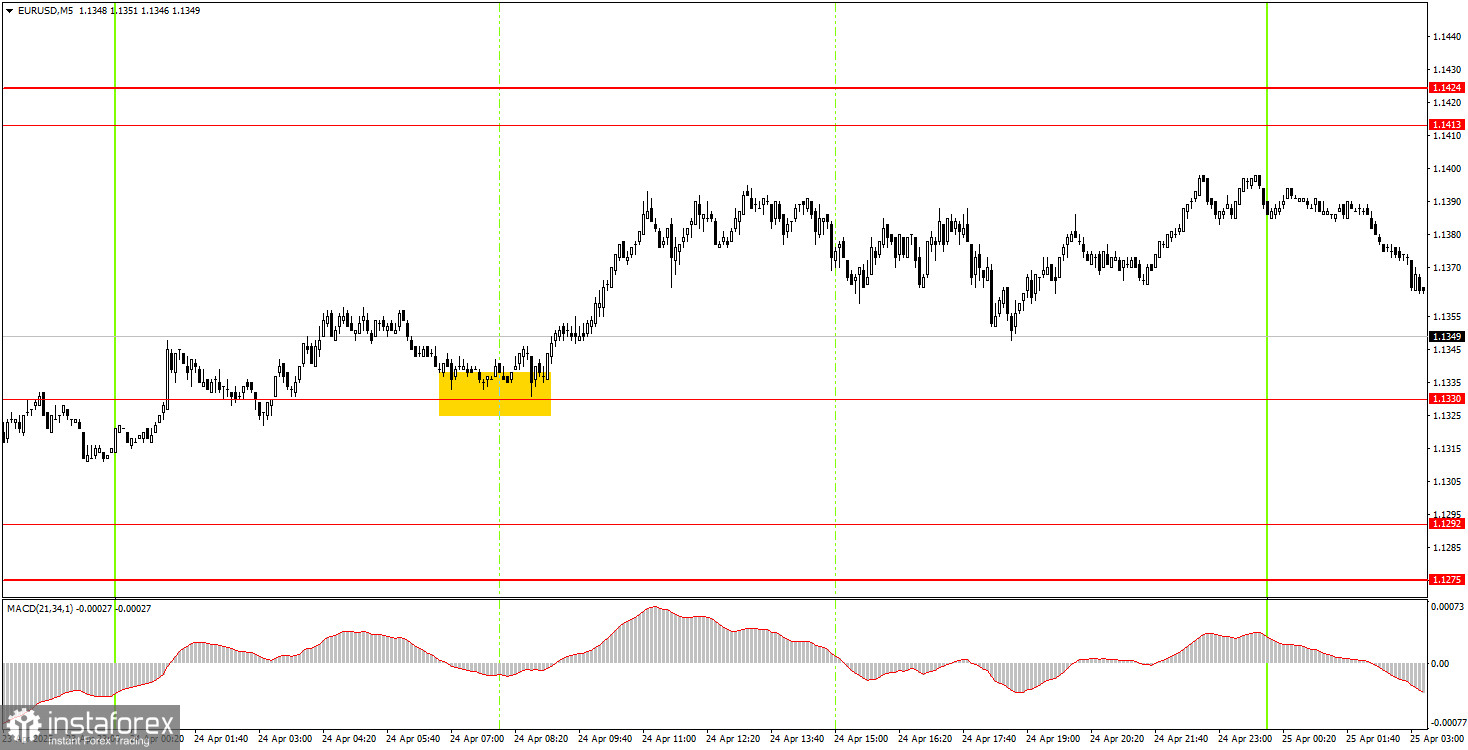
In the 5-minute timeframe, price movements remain far from ideal. One decent trading signal was formed yesterday. At the beginning of the European session, the price bounced off the 1.1330 level and then spent the rest of the day in an uptrend. This buy trade could have been manually closed in the evening, as the target level was not reached. The profit totaled about 35 pips. However, it's worth remembering that market movements remain highly erratic and chaotic. Strong, clean signals are now the exception rather than the rule.
In the hourly timeframe, EUR/USD maintains its upward trend. The new week began with a rally, but by Tuesday, Trump had triggered a decline. The market remains extremely negative toward the U.S. dollar and all things American. However, if Trump shifts toward de-escalating the trade conflict he initiated, the dollar may improve its standing soon.
On Friday, the pair could move in either direction again, as Trump's statements and decisions still drive market moves. No one can predict what the U.S. president will say today, and the market continues to ignore macroeconomic data.
On the 5-minute chart, consider trading levels at 1.0940–1.0952, 1.1011, 1.1091, 1.1132–1.1140, 1.1189–1.1191, 1.1275–1.1292, 1.1330, 1.1413–1.1424, 1.1474–1.1481, 1.1513, 1.1548, 1.1571, 1.1607–1.1622, 1.1666, 1.1689. No news is expected from the Eurozone on Friday. In the U.S., the University of Michigan Consumer Sentiment Index will be released, but we highly doubt the market will pay any attention to this report.
Support and Resistance Levels: These are target levels for opening or closing positions and can also serve as points for placing Take Profit orders.
Red Lines: Channels or trendlines indicating the current trend and the preferred direction for trading.
MACD Indicator (14,22,3): A histogram and signal line used as a supplementary source of trading signals.
Important Events and Reports: Found in the economic calendar, these can heavily influence price movements. Exercise caution or exit the market during their release to avoid sharp reversals.
Note for Beginner Forex Traders: Not every trade can be profitable. Developing a clear strategy and sound money management is key to long-term success in trading.
Le recensioni analitiche di InstaForex ti renderanno pienamente consapevole delle tendenze del mercato! Essendo un cliente InstaForex, ti viene fornito un gran numero di servizi gratuiti per il trading efficiente.


