 Rimani
Condizioni di trading
Strumenti


On Monday, the EUR/USD currency pair plunged. Traders have likely gotten used to the idea that the U.S. dollar can't show strong growth, but we had warned that the dollar would appreciate if the escalation of the trade war reversed course. On Monday, it was reported that China and the U.S. agreed to lower tariffs by 115% for 90 days. Naturally, this is not yet the end of the trade war, but it's a major step in that direction. To recap: earlier, Trump introduced a grace period for 75 countries during which 10% tariffs would apply, and later signed a trade deal with the UK. While none of these developments signal the complete end of the trade war, they indicate a truce and de-escalation. That's why the dollar is rising in response to these news headlines. All other factors still have a very limited influence on the pair's movement.
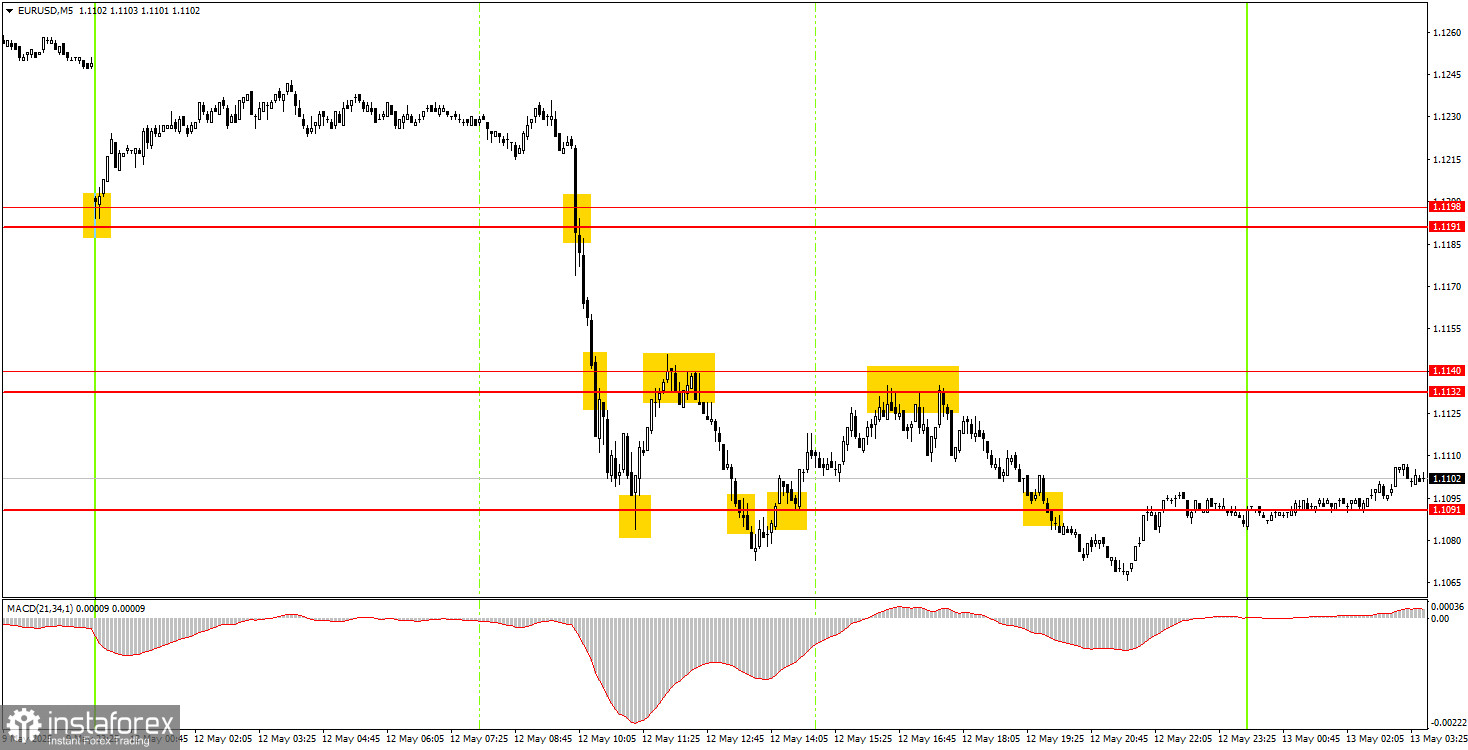
On Monday, quite a few trade signals were generated on the 5-minute timeframe. The pair traded technically, providing plenty of opportunities for novice traders to open positions. In fact, not a single false signal was formed during the day. If traders worked through all of them, that would amount to five trades and a total profit of about 160 pips.
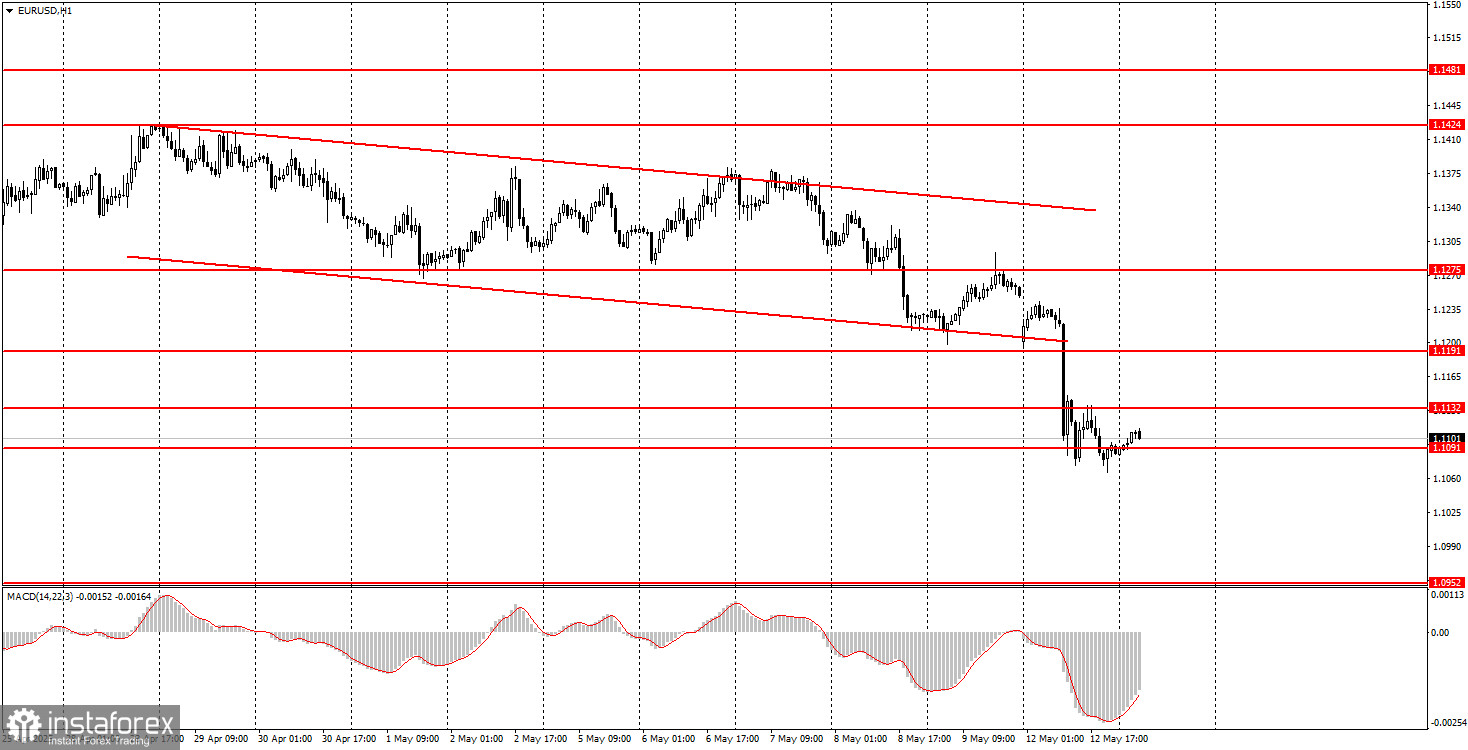
On the hourly timeframe, EUR/USD has finally started to show signs of a downward trend. The market remains heavily biased against the U.S. dollar, but since Trump has now moved toward de-escalating the trade conflict he initiated, the greenback could significantly strengthen in the near term. The strength of the dollar's rally will depend on how many agreements are successfully signed.
On Tuesday, EUR/USD may continue its decline, as the news of a U.S.-China agreement is a strong, market-moving development. It favors the dollar, and the market cannot simply ignore it.
On the 5-minute timeframe, focus on the following levels: 1.0940–1.0952, 1.1011, 1.1091, 1.1132–1.1140, 1.1191–1.1198, 1.1275–1.1292, 1.1413–1.1424, 1.1474–1.1481, 1.1513, 1.1548, 1.1571, 1.1607–1.1622. There are no significant events in the Eurozone on Tuesday, while the U.S. will publish its April inflation report. While this is an important macro report, the market remains focused on the trade war, not on the Federal Reserve's monetary policy outlook at this time.
Support and Resistance Levels: These are target levels for opening or closing positions and can also serve as points for placing Take Profit orders.
Red Lines: Channels or trendlines indicating the current trend and the preferred direction for trading.
MACD Indicator (14,22,3): A histogram and signal line used as a supplementary source of trading signals.
Important Events and Reports: Found in the economic calendar, these can heavily influence price movements. Exercise caution or exit the market during their release to avoid sharp reversals.
Forex trading beginners should remember that not every trade will be profitable. Developing a clear strategy and practicing proper money management are essential for long-term trading success.
Le recensioni analitiche di InstaForex ti renderanno pienamente consapevole delle tendenze del mercato! Essendo un cliente InstaForex, ti viene fornito un gran numero di servizi gratuiti per il trading efficiente.


