 Rimani
Condizioni di trading
Strumenti


On Thursday, Bitcoin's price reached the target level of 111,770. The Marlin oscillator appears to be lagging behind the price, giving the impression of a potential divergence — though unconventional. For now, we adhere to the scenario of the oscillator developing within a long-term upward channel.
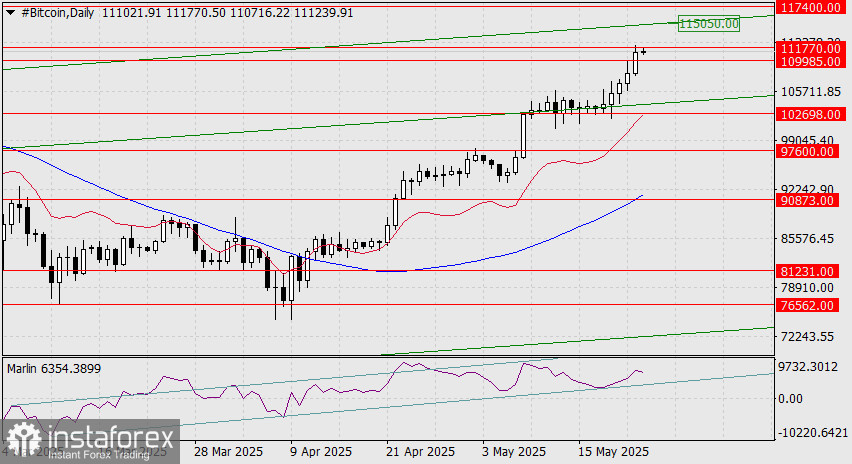
A correction from the current level is certainly possible. The reference level is 109,985, which corresponds to the January 20 high. A decline to this support level would not significantly affect the overall bullish trend. At this stage, Marlin becomes the key indicator — it should remain above the lower boundary of its channel.
Once the correction is complete and the price breaks above 111,770, the next target will be 115,050 — the upper line of the price channel — followed by 117,400, which represents the 361.8% Fibonacci reaction level from the primary wave in the first half of April.
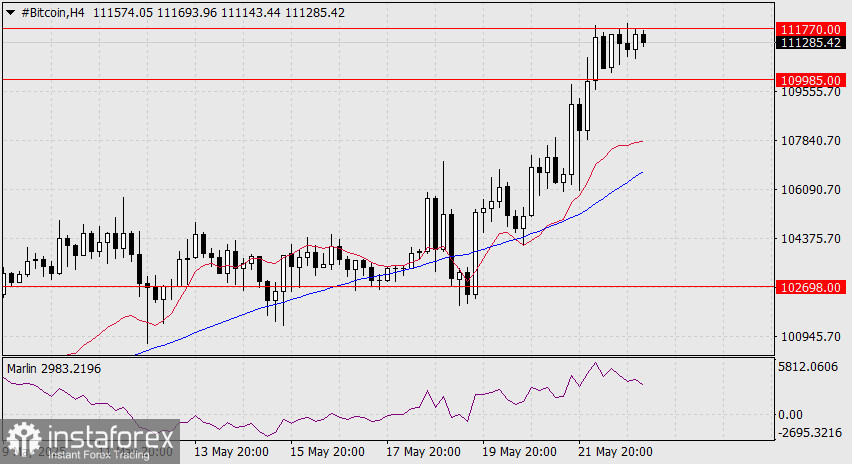
On the 4-hour chart, the price has formed a triangular consolidation pattern below the 111,770 level, while the Marlin oscillator is declining. This creates the setup for an upward move from a lower base. We now await the correction's end.
Le recensioni analitiche di InstaForex ti renderanno pienamente consapevole delle tendenze del mercato! Essendo un cliente InstaForex, ti viene fornito un gran numero di servizi gratuiti per il trading efficiente.


