 Rimani
Condizioni di trading
Strumenti


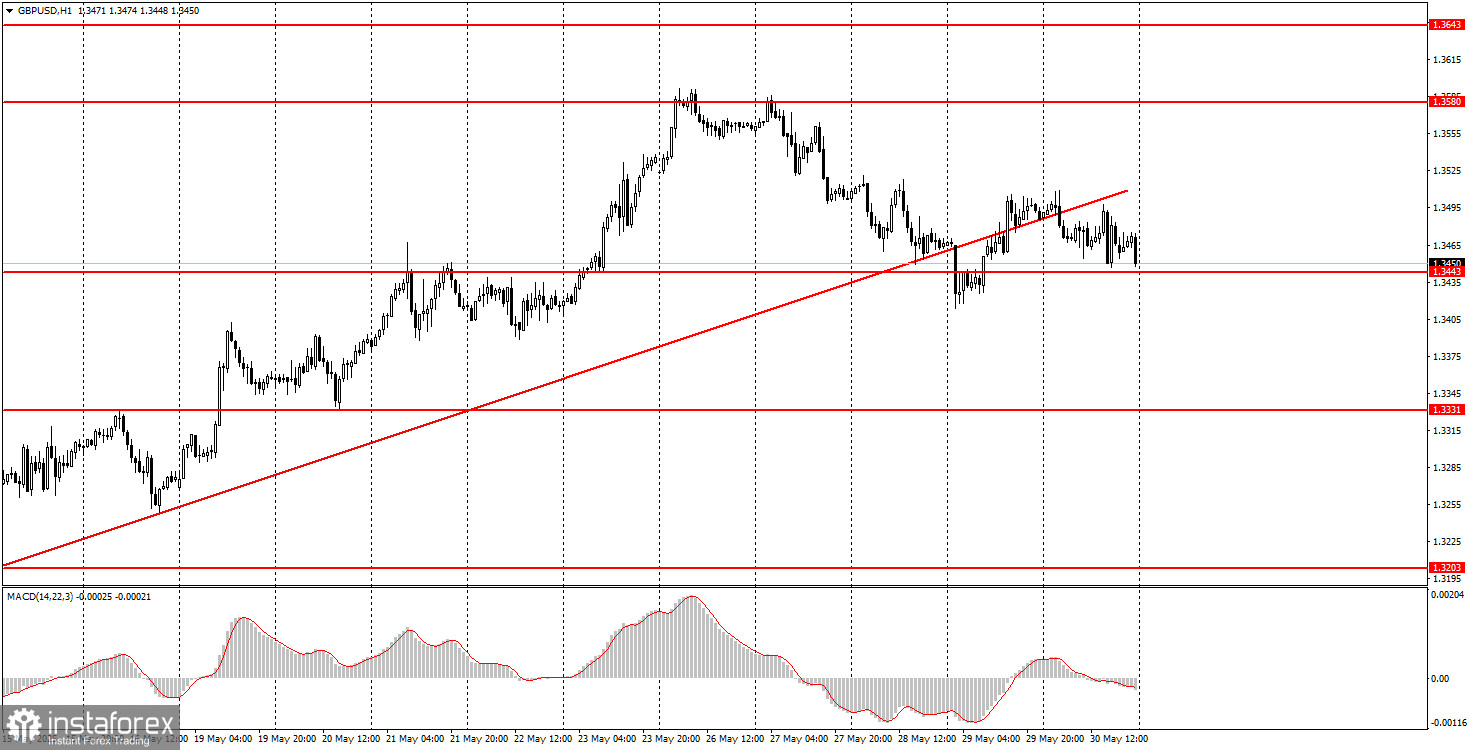
The GBP/USD pair also traded quite calmly throughout Friday. There were no important news or events that day, so the volatility was only 65 pips. The pair broke the ascending trend line, indicating that the downward correction may continue into the new week. Nevertheless, we remind you that the situation with the global trade confrontation has not changed. Trump's tariffs remain in place, so there is no talk of de-escalation of the trade conflict. Moreover, there are no reports of trade deals or even trade negotiations. Donald Trump continues to assure the media that trade agreements will be signed, but there is no actual information regarding this. Even the much-discussed negotiations with the European Union are not guaranteed to succeed or conclude before July 9. Thus, the U.S. dollar can currently count only on a corrective rise.
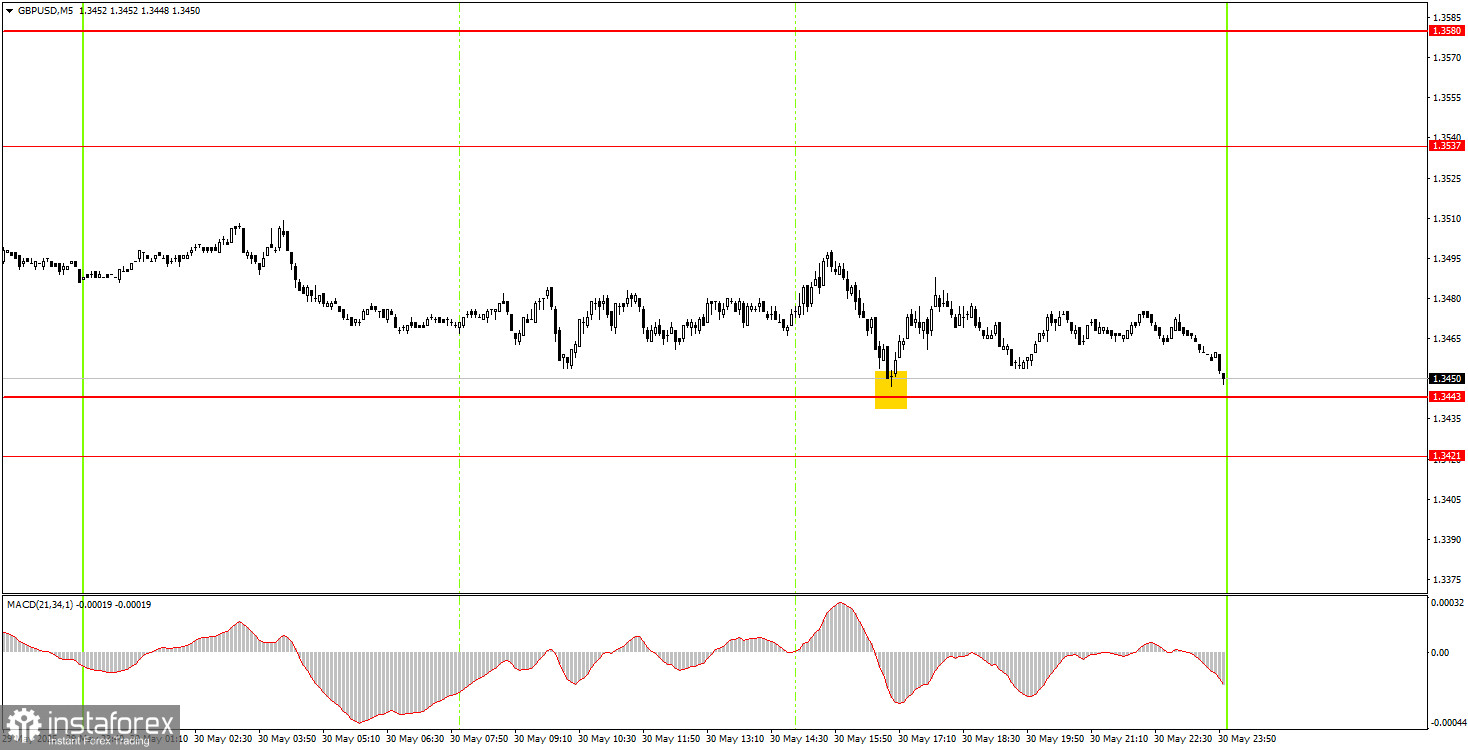
Only one trading signal was formed on Friday in the 5-minute timeframe, and the price mostly moved sideways. Only during the U.S. trading session did the pair bounce slightly from the 1.3443 level, but this bounce did not lead to a substantial rise. Nevertheless, the price increased by 20 pips, meaning the trade could not have closed at a loss.
In the hourly timeframe, the GBP/USD pair focuses only on Trump and remains quite skeptical about his policies. There are some signs of reduced trade tension, but the market does not feel a surge of optimism about it. Last week, the dollar slightly strengthened its position, but this is merely a technical correction that may continue. We would not call it a full-fledged dollar trend even after breaking the trend line.
The GBP/USD pair may resume its downward movement on Monday, given that the trend line was broken. However, few fundamental factors support such a move. We still view the growth of the U.S. dollar skeptically, but it is better to trade now based on technical factors.
For the 5-minute timeframe, you can trade around the levels: 1.2913, 1.2980–1.2993, 1.3043, 1.3102–1.3107, 1.3203–1.3211, 1.3259, 1.3329–1.3331, 1.3421–1.3443, 1.3537, 1.3580–1.3592, 1.3652–1.3660, 1.3695. On Monday, the UK and the U.S. are scheduled to release manufacturing sector business activity indices. We believe that only the ISM index in the U.S. might trigger a market reaction, but it is unlikely to impact the overall technical picture significantly.
Support and Resistance Levels: These are target levels for opening or closing positions and can also serve as points for placing Take Profit orders.
Red Lines: Channels or trendlines indicating the current trend and the preferred direction for trading.
MACD Indicator (14,22,3): A histogram and signal line used as a supplementary source of trading signals.
Important Events and Reports: Found in the economic calendar, these can heavily influence price movements. Exercise caution or exit the market during their release to avoid sharp reversals.
Forex trading beginners should remember that not every trade will be profitable. Developing a clear strategy and practicing proper money management are essential for long-term trading success.
Le recensioni analitiche di InstaForex ti renderanno pienamente consapevole delle tendenze del mercato! Essendo un cliente InstaForex, ti viene fornito un gran numero di servizi gratuiti per il trading efficiente.


