 Rimani
Condizioni di trading
Strumenti



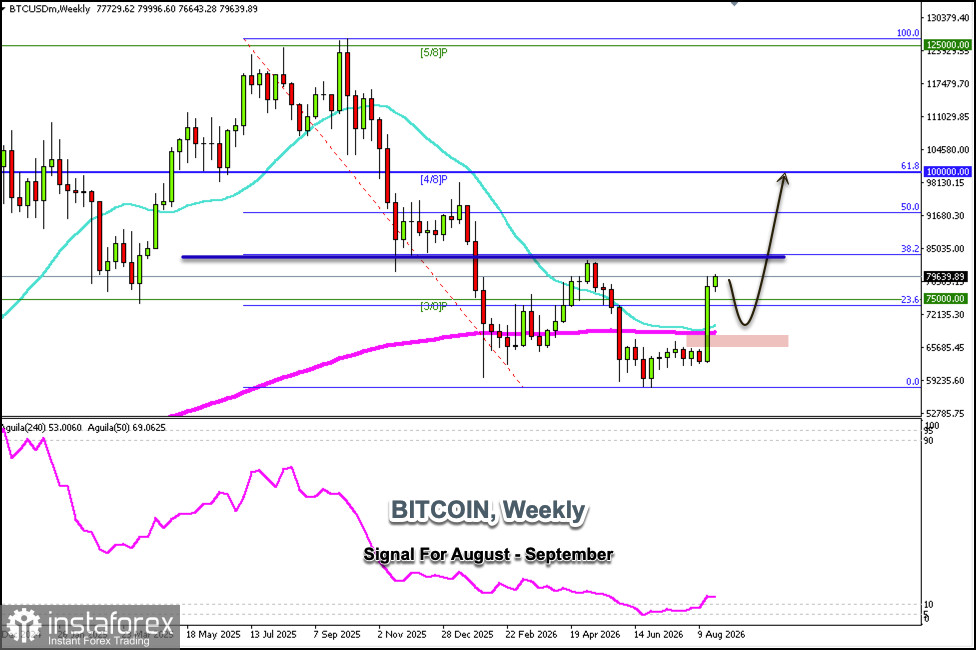
The weekly Bitcoin chart shows a strong uptrend, and it is likely to continue rising in the coming days until it reaches the 38.2% Fibonacci retracement level around $85,000.
On the daily chart, Bitcoin faces strong resistance around $81,250—a level representing the +2/8 Murray level—and is also technically overbought. Therefore, if the price reaches this level in the coming hours, it could be considered a signal to sell below this zone.
If the upward momentum prevails and Bitcoin breaks above $81,250, it is likely to continue rising until it reaches April's high around $85,000.
Our outlook remains bullish, but we must be very cautious, as a technical correction is expected below $81,250 in the coming weeks. If Bitcoin remains below this level, we can sell with targets at the 3/8 Murray level around $75,000 and ultimately expect it to reach the 200 EMA, which coincides with the 21 SMA around $66,500.
Bitcoin is expected to hover between $81,250 and $75,000 over the next few days; this will be a good range for buying and selling while awaiting consolidation.
Le recensioni analitiche di InstaForex ti renderanno pienamente consapevole delle tendenze del mercato! Essendo un cliente InstaForex, ti viene fornito un gran numero di servizi gratuiti per il trading efficiente.


