 Rimani

Condizioni di trading
Strumenti


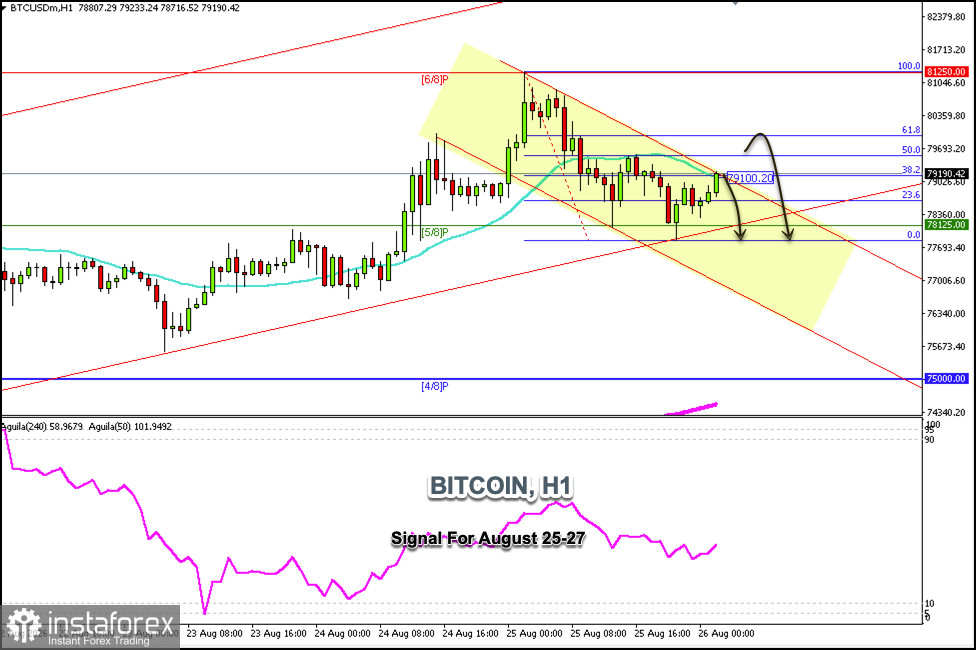
Bitcoin is trading around $79,120 within a downtrend channel formed on the H1 chart since its high of $81,250. Bitcoin could continue its rise in the coming hours until it reaches the 61.8% Fibonacci level around $80,000.
If Bitcoin falls below the 21 SMA—located around the 38.2% Fibonacci level—in the coming hours, we could expect it to resume its downtrend and potentially reach the 5/8 Murray level around $78,125; it could even approach the August 24 low around $76,000.
Conversely, a decisive break above the 21 SMA and above $79,100 will be seen as a buy signal with targets at the psychological level of $80,000; ultimately, we expect it to reach the 6/8 Murray level around $81,250.
The Fibonacci indicator suggests a potential technical rebound to the psychological level of $80,000. Technically, we could wait for this zone to open short positions or expect BTC to encounter strong resistance and, in turn, form a double-top pattern around $81,225—which could also be seen as a clear signal to sell.
A decisive break below the 5/8 Murray level could signal a strong bearish trend, and we expect it to reach the 4/8 Murray level around $75,000 in the short term.
Le recensioni analitiche di InstaForex ti renderanno pienamente consapevole delle tendenze del mercato! Essendo un cliente InstaForex, ti viene fornito un gran numero di servizi gratuiti per il trading efficiente.


