 Rimani
Condizioni di trading
Strumenti


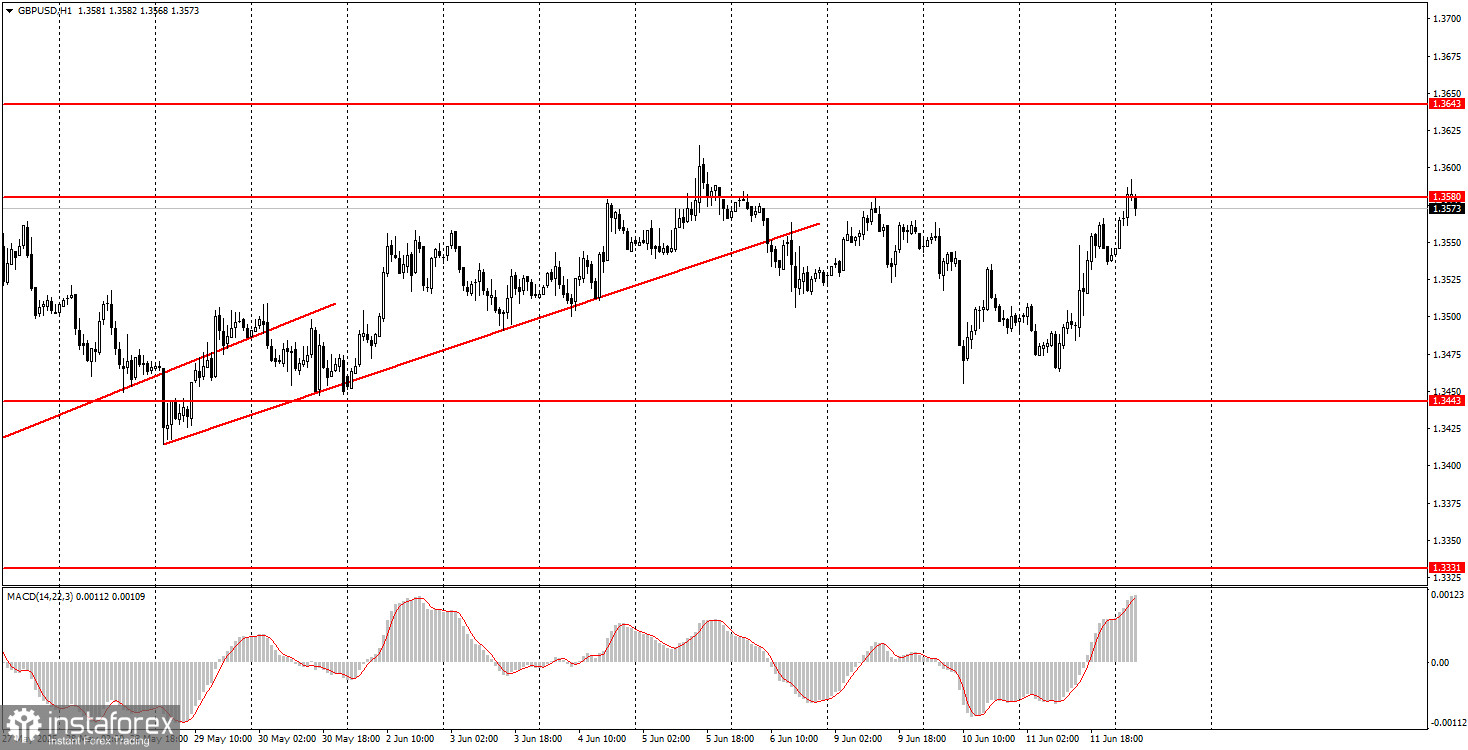
On Wednesday, the GBP/USD pair moved in a manner similar to the EUR/USD pair. The U.S. inflation report became a new driver for the decline of the U.S. dollar, even though the figures were not disastrous. Inflation remained at 2.8% year-over-year, meaning no change occurred. Nevertheless, any excuse to sell the dollar is considered good enough in the current environment. In reality, there are plenty of reasons to offload the U.S. currency. Donald Trump's policies remain hostile and protectionist, with no visible positive outcomes so far. Thus, the British pound took advantage of another opportunity to strengthen further. The currency is now near its three-year highs again, and we see no reason why the dollar should stop falling just because of Trump.
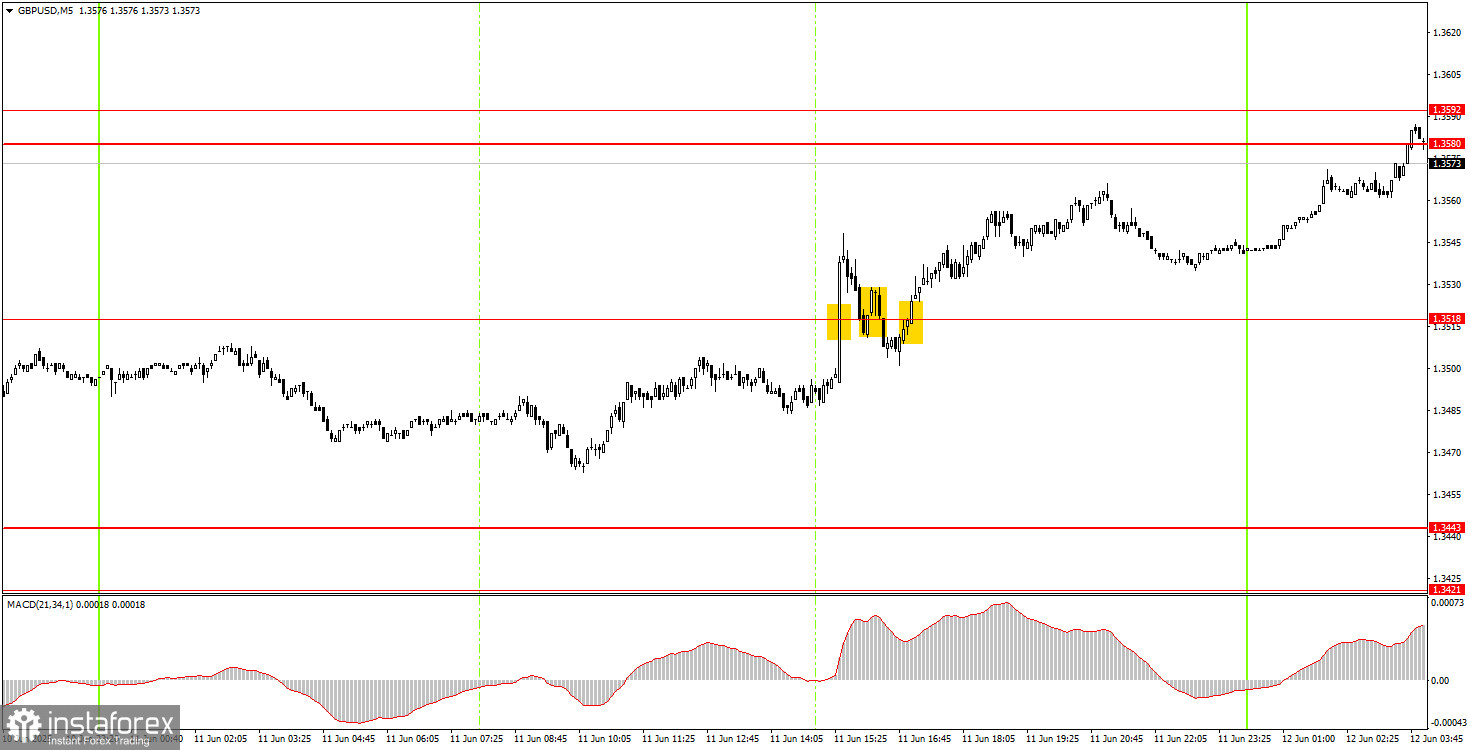
On the 5-minute timeframe, the pair gave very weak trading signals on Wednesday; however, losses could have been prevented. The first buy signal appeared precisely when the U.S. inflation report was released, making it impossible to enter the market in advance. When the price soared abruptly, it was hardly wise to open new trades. The price then pulled back and consolidated below the 1.3518 level, resulting in a false signal, while movements remained highly emotional. Another buy signal followed near the same level, after which the pair resumed its rise.
In the hourly timeframe, the GBP/USD pair continues to track Trump's actions and remains skeptical of his policies. While there are some signs of easing trade tensions, the market shows little optimism in response. Therefore, as before, the market uses every opportunity to sell the dollar, not to buy it. This trend will likely continue until the market sees genuine signs of ending the trade war and until Trump stops making unauthorized decisions.
The GBP/USD pair may pause around 1.3580–1.3592 on Thursday. However, a breakout above this zone would allow for new long positions targeting 1.3652–1.3660 and 1.3695.
On the 5-minute chart, trading can currently be based on the following levels: 1.3043, 1.3102–1.3107, 1.3203–1.3211, 1.3259, 1.3329–1.3331, 1.3421–1.3443, 1.3518, 1.3580–1.3592, 1.3652–1.3660, 1.3695, 1.3740. On Thursday, the U.S. is scheduled to release PPI data and jobless claims, which are currently of secondary importance. In the UK, monthly GDP and industrial production data will be published. These figures are not expected to be particularly strong, but the pound does not currently need domestic reports to rise.
Support and Resistance Levels: These are target levels for opening or closing positions and can also serve as points for placing Take Profit orders.
Red Lines: Channels or trendlines indicating the current trend and the preferred direction for trading.
MACD Indicator (14,22,3): A histogram and signal line used as a supplementary source of trading signals.
Important Events and Reports: Found in the economic calendar, these can heavily influence price movements. Exercise caution or exit the market during their release to avoid sharp reversals.
Forex trading beginners should remember that not every trade will be profitable. Developing a clear strategy and practicing proper money management are essential for long-term trading success.
Le recensioni analitiche di InstaForex ti renderanno pienamente consapevole delle tendenze del mercato! Essendo un cliente InstaForex, ti viene fornito un gran numero di servizi gratuiti per il trading efficiente.


