 Rimani
Condizioni di trading
Strumenti



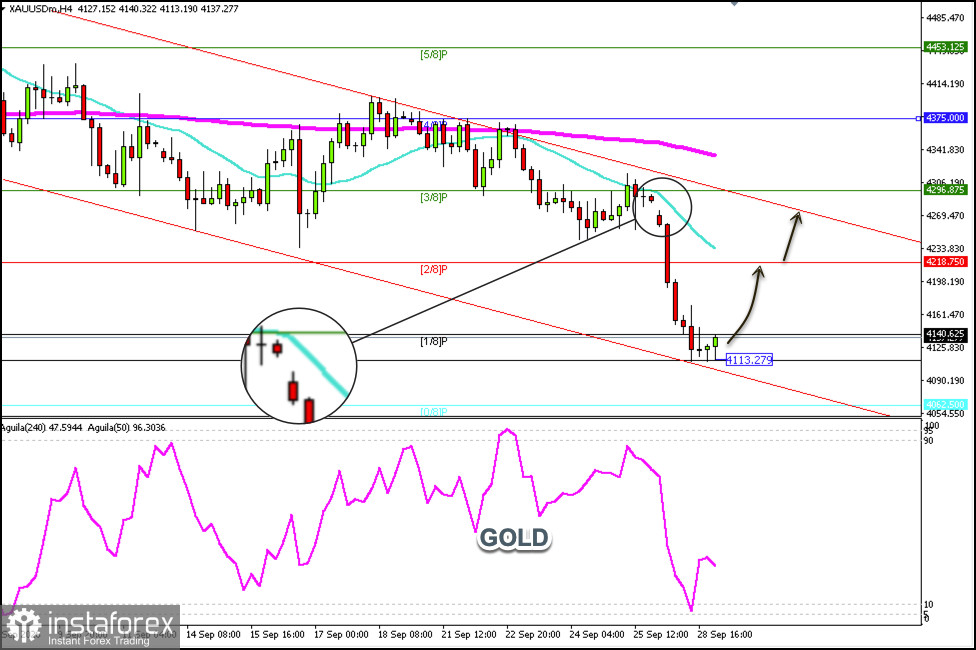
XAU/USD is trading around $4,137 within a secondary downtrend channel that has been forming since early September; technically, gold could continue to fall as we are seeing a bearish signal.
If gold breaks above $4,140 (1/8 Murray) in the coming hours, the instrument could rebound, and we could expect it to reach the 2/8 Murray level around $4,218.
If bearish momentum prevails, the price could reach the lower band of the downtrend channel around $4,100 and even the 0/8 Murray level around $4,062.
A consolidation above the 1/8 Murray level around $4,140—which represents a technical reversal zone—could set the stage for a recovery in gold, potentially closing the gap left earlier this week around $4,285.
Given that gold left a gap around $4,285, the outlook is bullish, and we could look for buying opportunities in the coming days, as we technically expect it to reach this level. Therefore, any pullback—as long as the price trades above $4,113—will be considered a buy signal.
We can observe on the H4 chart the formation of a triple bottom pattern, which represents a bullish signal for the coming days.
Le recensioni analitiche di InstaForex ti renderanno pienamente consapevole delle tendenze del mercato! Essendo un cliente InstaForex, ti viene fornito un gran numero di servizi gratuiti per il trading efficiente.


