 Rimani
Condizioni di trading
Strumenti



The daily timeframe chart for Gold (GOLD) shows price action confined to a corrective downward path, following a bearish reversal from a peak near the second monthly resistance level (Monthly R2) at 4659.09. The price is currently trading around the 4145.70 level, as it attempts to stabilize above the most recent pivotal low following the latest pullback.
Technical Analysis and Price Action
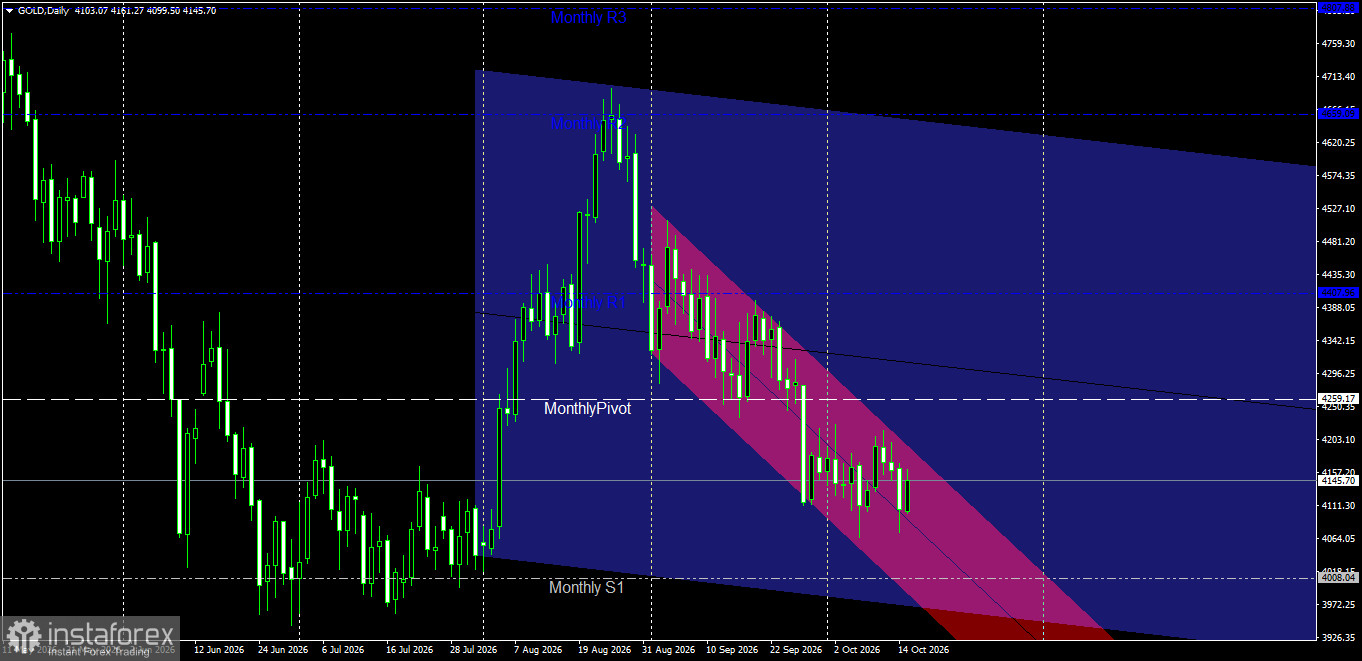
Price Channel Structure: The price is trading within a broad, primary downward channel (in blue) and a steeper, secondary downward channel (in pink/red). Gold appears to be in a phase of consolidation and sideways fluctuation near the lower boundary of the secondary channel, following a previous rebound from levels close to the first monthly support (Monthly S1) at 4008.04.
Interaction with Monthly Pivot Levels: The price declined sharply, breaking below the monthly pivot point at 4259.17 and the first monthly resistance level (Monthly R1) at 4407.96. Trading is currently settled below the monthly pivot line of 4259.17; consequently, any current upward movement is considered merely a corrective rally, unless the key pivot levels are decisively broken.
Key Support and Resistance Levels
Major Resistance Levels:
First Resistance: The 4203.10 – 4259.17 range (covering recent intraday peaks and the monthly pivot point). Second Resistance: 4407.96 (Monthly R1).
Pivot Resistance: 4659.09 (Monthly R2).
Key Support Levels:
First Support: 4111.30 – 4157.20 (range of current intraday lows).
Second Support: 4008.04 (Monthly S1).
Main Support: 3926.35 (lower boundary of the primary descending channel).
Price Action Outlook and Scenarios
Bearish Scenario (Primary):
A negative trend is the most likely outcome on the daily timeframe, provided the price remains below the monthly pivot level of 4259.17 and within the pink-colored channel.
Recommendation: Sell upon a retest of the resistance zone between 4203.10 and 4259.17, contingent on the appearance of a bearish reversal candle.
Technical Targets: 4111.30 as the first target, with potential extension toward the first monthly support (Monthly S1) at 4008.04.
Stop Loss: A daily close above 4259.17.
Bullish Corrective Scenario (Alternative):
This scenario is triggered if the price breaks above the upper boundary of the sub-channel and the monthly pivot level of 4259.17, followed by a strong daily close above that level.
Validation Condition: A breakout above 4259.17 and a daily close above it. Technical objectives: To pave the way for an extension of the upward correction toward 4342.15, and subsequently 4407.96.
The four-hour (H4) chart for Gold (GOLD) shows active price movement, with the price returning to trade around the 4145.77 level. It is currently attempting to stabilize and consolidate following a sharp recent decline that brought it close to the first weekly support level (Weekly S1) at 4104.37.
Technical Analysis and Price Action
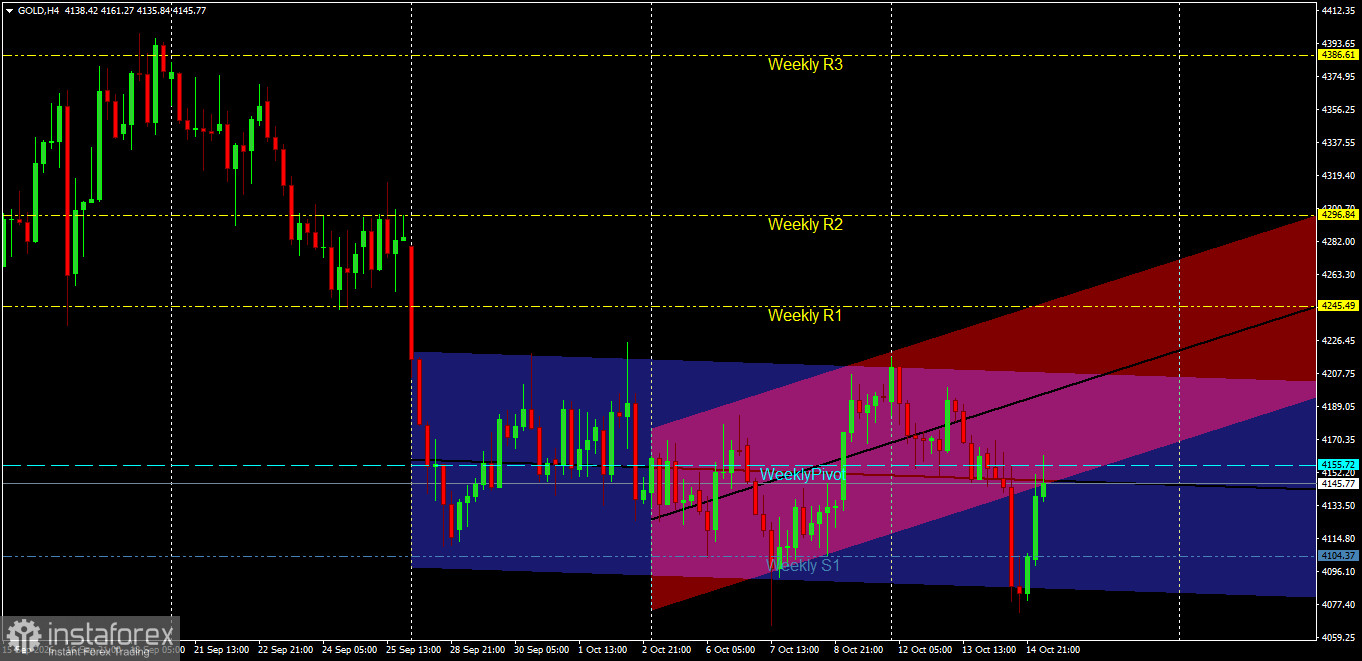
Price Channel Structure: The price is moving within a broad, primary descending channel (in blue), which intersects with a secondary, ascending (corrective) channel (in pink/red). Notably, the price rebounded strongly from the lower boundary of the primary channel—following a brief breakout—forming a local bottom and moving upward toward the channel's midline and the overlapping boundaries of the price channels.
Interaction with Pivot Levels: The price is currently fluctuating near the weekly pivot point (Weekly Pivot) at 4155.72. This level serves as a critical technical juncture; it acts as an immediate resistance barrier hindering any immediate bullish momentum. Conversely, stabilizing above this level would signal the return of buyers and potentially trigger a recovery toward higher resistance levels, such as the first weekly resistance (Weekly R1) at 4245.49.
Key Support and Resistance Levels
Major Resistance Levels:
First Resistance: 4155.72 (Weekly Pivot).
Second Resistance: 4245.49 (First Weekly Resistance, Weekly R1). Pivot Resistance: 4296.84 (Weekly R2).
Key Support Levels:
First Support: 4133.50 – 4135.84 (recent intraday lows).
Second Support: 4104.37 (Weekly S1).
Major Support: 4077.40 (the most recent low and the lower boundary of the channel).
Price Action Outlook and Trading Recommendations
Bullish Corrective Scenario (Primary, contingent on a breakout):
Triggered upon a confirmed breakout above the weekly pivot point at 4155.72, followed by stabilization above it, marked by a strong 4-hour candle.
Expected Path: Continuation of the upward rebound, targeting 4202.50 as an initial objective, with potential extension toward 4245.49 (Weekly R1).
Recommendation: Buy upon the close of a clear 4-hour candle above 4155.72.
Stop Loss: A 4-hour candle close below 4133.50.
Bearish Scenario (Alternative):
Triggered if the price fails to break above the weekly pivot at 4155.72 and reverses downward.
Expected Path: A resumption of the decline, targeting nearby support at 4133.50; if this level is broken, the pullback may extend toward 4104.37 (Weekly S1). Recommendation: Sell, provided that resistance at 4155.72 holds and a bearish reversal candle appears.
Risk Management
Trading during such transitional phases requires strict adherence to capital management protocols. Limit risk to a maximum of 1%–2% per trade, and carefully place stop-loss orders to protect the account against sudden volatility.
Le recensioni analitiche di InstaForex ti renderanno pienamente consapevole delle tendenze del mercato! Essendo un cliente InstaForex, ti viene fornito un gran numero di servizi gratuiti per il trading efficiente.


