empty
 
 
Stai per lasciare
www.instaforex.eu >
il sito gestito da
INSTANT TRADING EU LTD
Apri un conto

09.07.202508:46 Forex Analysis & Reviews: How to Trade the GBP/USD Currency Pair on July 9th: Simple Tips and Trade Analysis for Beginners

Queste informazioni sono fornite ai clienti al dettaglio e professionisti come parte della comunicazione di marketing. Non contiene e non deve essere interpretata come contenente consigli di investimento o raccomandazioni di investimento o un'offerta o una sollecitazione a impegnarsi in qualsiasi transazione o strategia in strumenti finanziari. Le performance passate non sono una garanzia o una previsione delle performance future. Instant Trading EU Ltd. non rilascia alcuna dichiarazione e non si assume alcuna responsabilità in merito all'accuratezza o completezza delle informazioni fornite, o qualsiasi perdita derivante da qualsiasi investimento basato su analisi, previsioni o altre informazioni fornite da un dipendente della Società o altri. Il disclaimer completo è disponibile qui.

Tuesday Trade Breakdown: 1H Chart for GBP/USD

Exchange Rates 09.07.2025 analysis

On Tuesday, the GBP/USD pair continued its moderate downward movement, which is clearly of a technical and corrective nature. On both Monday and Tuesday, there were no significant macroeconomic events in either the U.S. or the UK. Only Donald Trump once again sought to "stimulate" trade partners by announcing tariff increases for 15 countries. The market did not react to this decision from the U.S. President—otherwise, we would have seen another sharp decline in the dollar. The market remained calm because tariffs were not actually raised. Trump stated that they would increase only starting August 1, thereby giving countries time to continue negotiations with the U.S. for trade deals. And a lot can happen before August 1. Trump may revise the tariff rates ten more times. Additionally, the President announced overnight his plans to raise tariffs on all copper imports. Clearly, there are still no signs of de-escalation in the trade conflict.

5M Chart for GBP/USD

Exchange Rates 09.07.2025 analysis

On the 5-minute timeframe, several strong trading signals were formed on Tuesday. A reminder to novice traders: not every signal can be profitable. Profitable trading consists of both losing and winning trades. Yesterday was a successful day. First, the price rebounded from the 1.3643 level with perfect accuracy, and during the start of the U.S. trading session, it reached the 1.3518–1.3535 level. A rebound from this area provided a long entry opportunity, and by the end of the day, the price had returned to the 1.3574–1.3590 level. As a result, two trades could have been opened—both profitable.

Trading on Wednesday:

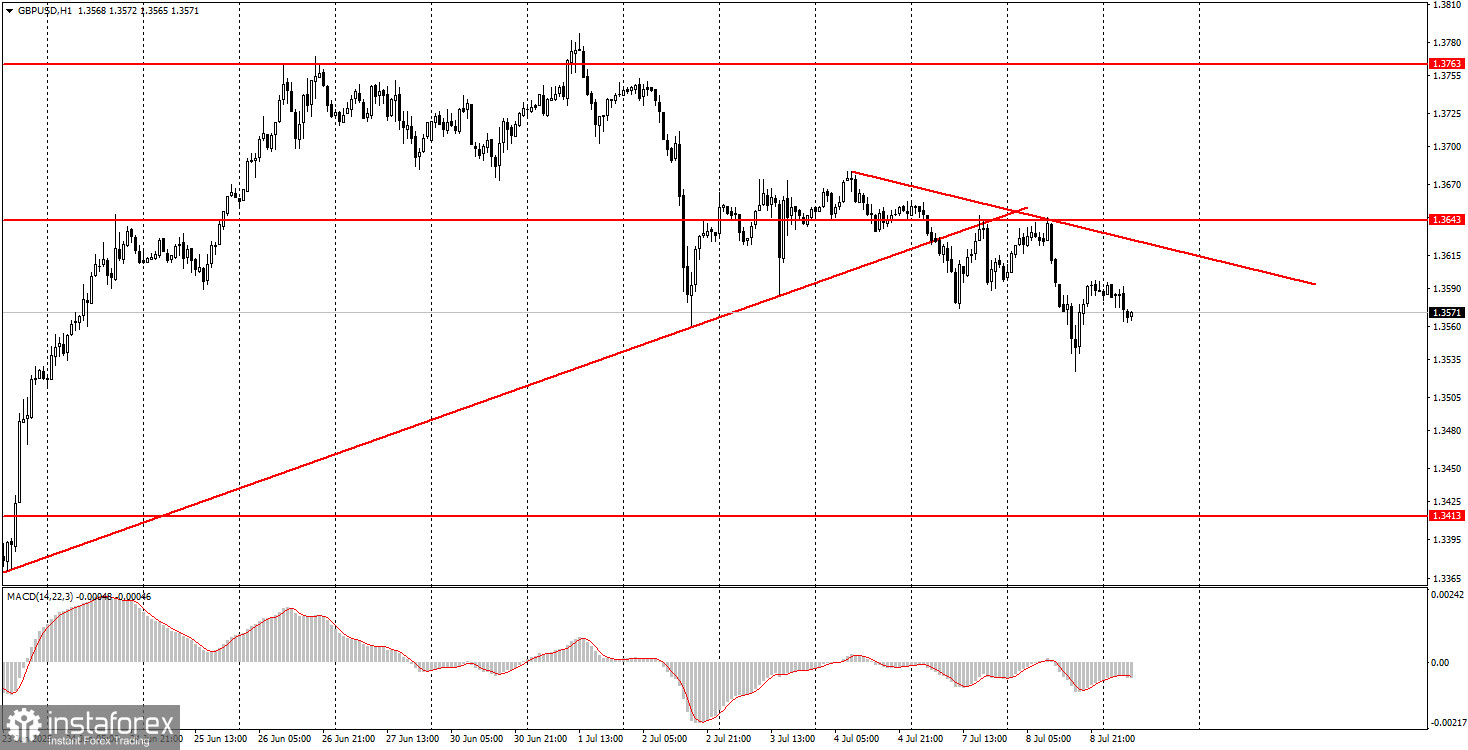
On the hourly timeframe, the GBP/USD pair experienced a sharp drop last week, but that was the end of the dollar's rally. Over the last four days, the U.S. dollar has strengthened only marginally. In fact, it only rose for one day while ignoring a series of strong U.S. economic reports. Therefore, the conclusion remains the same: traders are still unwilling to buy the dollar under any circumstances. The movement we are currently observing is a technical correction.

On Wednesday, GBP/USD may again show low volatility, as there are no important events scheduled. A descending trendline has formed on the hourly chart, and breaking above it would indicate a return to the upward trend. The dollar could resume weakening at any time.

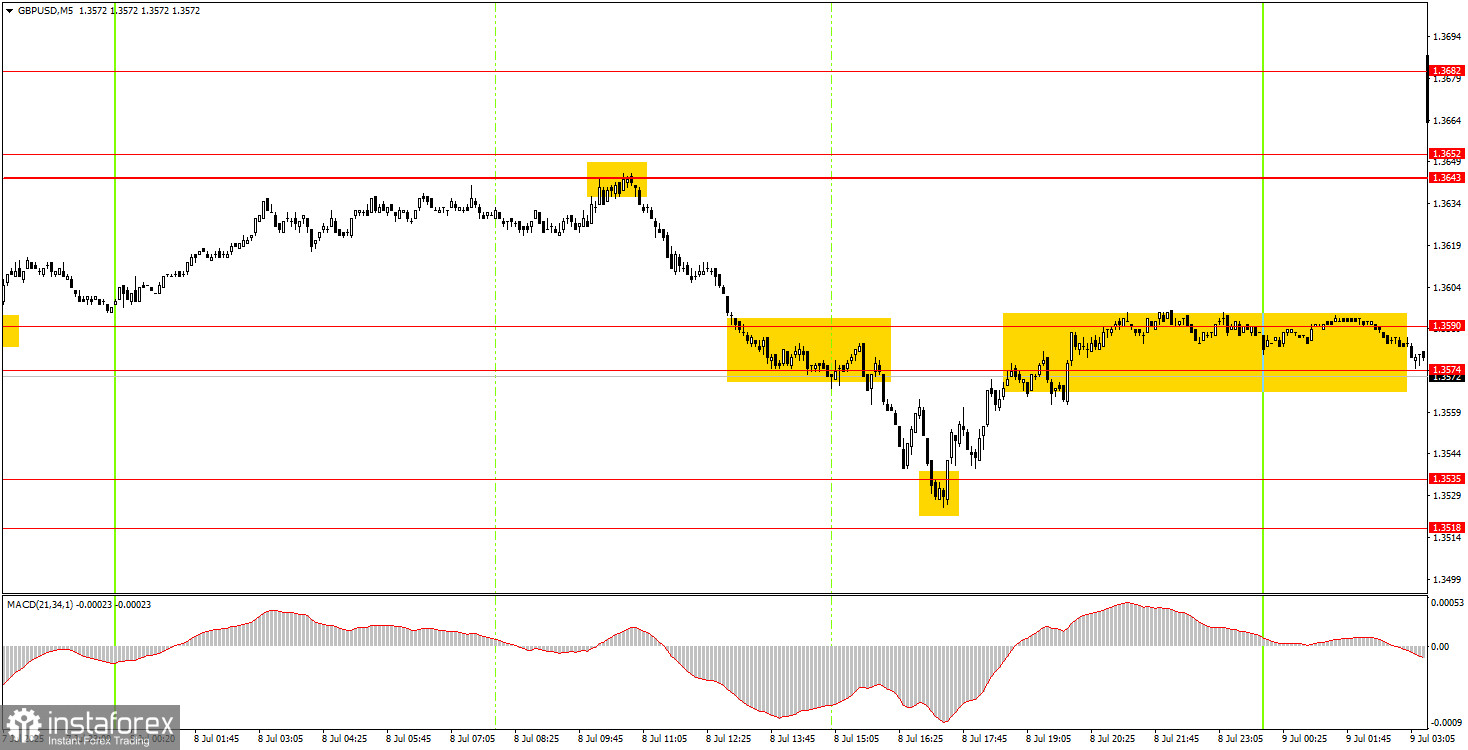
On the 5-minute timeframe, active levels for trading include: 1.3203–1.3211, 1.3259, 1.3329–1.3331, 1.3413–1.3421, 1.3518–1.3535, 1.3574–1.3590, 1.3643–1.3652, 1.3682, 1.3763, 1.3814–1.3832.

No reports or speeches are scheduled in the UK or U.S. for Wednesday, so once again, traders are likely to respond only to Donald Trump's announcements and decisions.

Core Trading System Rules:

  1. Signal Strength is determined by how quickly the signal forms (bounce or breakout from level). The faster it forms, the stronger the signal.
  2. If two or more false signals occur at a given level, all subsequent signals from that level should be ignored.
  3. During sideways movement, any pair can produce many false signals or none at all. At the first signs of a range, it's best to stop trading.
  4. Trades should be opened between the start of the European session and the middle of the U.S. session. All positions should be closed manually afterward.
  5. On the hourly timeframe, MACD-based signals should only be traded when there is strong volatility and a confirmed trend indicated by a trendline or trend channel.
  6. If two levels are very close (5 to 20 points apart), treat them as a single support/resistance zone.
  7. Once a position has moved 20 points in the right direction, the Stop Loss should be moved to breakeven.

What's on the Chart:

  • Support and Resistance Levels – Price levels that serve as trade targets. Take Profits can be placed near them.
  • Red Lines – Trendlines or channels that show the current trend and preferred trading direction.
  • MACD (14, 22, 3) Indicator – Histogram and signal line that can serve as additional sources of trade signals.
  • Key Events and Reports (always listed in the news calendar) can strongly influence the pair. It is recommended to trade with caution or exit the market during these events to avoid sharp reversals.

For beginner traders, remember that not every trade will be profitable. Developing a clear strategy and sound money management is the foundation for long-term success in Forex trading.

Eseguito da Paolo Greco
Esperto analista di InstaForex
© 2007-2025

Apri un conto di trading

Le recensioni analitiche di InstaForex ti renderanno pienamente consapevole delle tendenze del mercato! Essendo un cliente InstaForex, ti viene fornito un gran numero di servizi gratuiti per il trading efficiente.


Stai per lasciare www.instaforex.eu, il sito Web gestito da INSTANT TRADING EU LTD
In questo momento non potete parlare al telefono?
Ponete la vostra domanda nella chat.
Widget callback

Turn "Do Not Track" off