 Rimani
Condizioni di trading
Strumenti



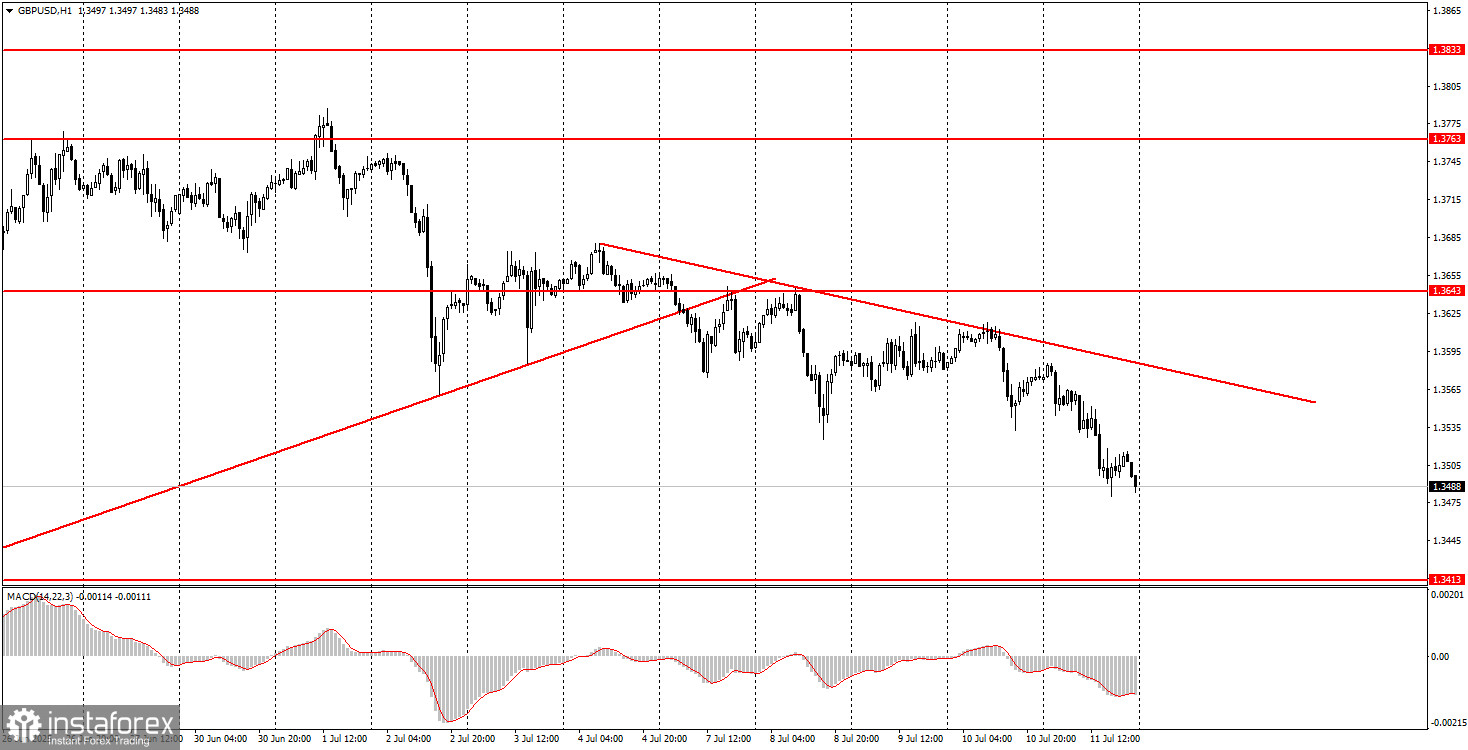
The GBP/USD pair traded with a relatively substantial decline on Friday. Why did the British pound fall again while the euro remained stationary? We're used to seeing similar dynamics between the euro and the pound. However, on Friday, the UK published reports on monthly GDP and industrial production. As previously noted, these are not the most important reports and likely were not the direct trigger for the pound's decline.
Nevertheless, they probably affected overall market sentiment, as both figures came in weak. Therefore, if we can put it this way, the pound was more prone to decline than the euro on Friday. Additionally, the euro has a strong support level at 1.1666, while the pound has no equivalent. The descending trend line continues to indicate a local bearish trend, so from a technical perspective, the move is entirely logical.
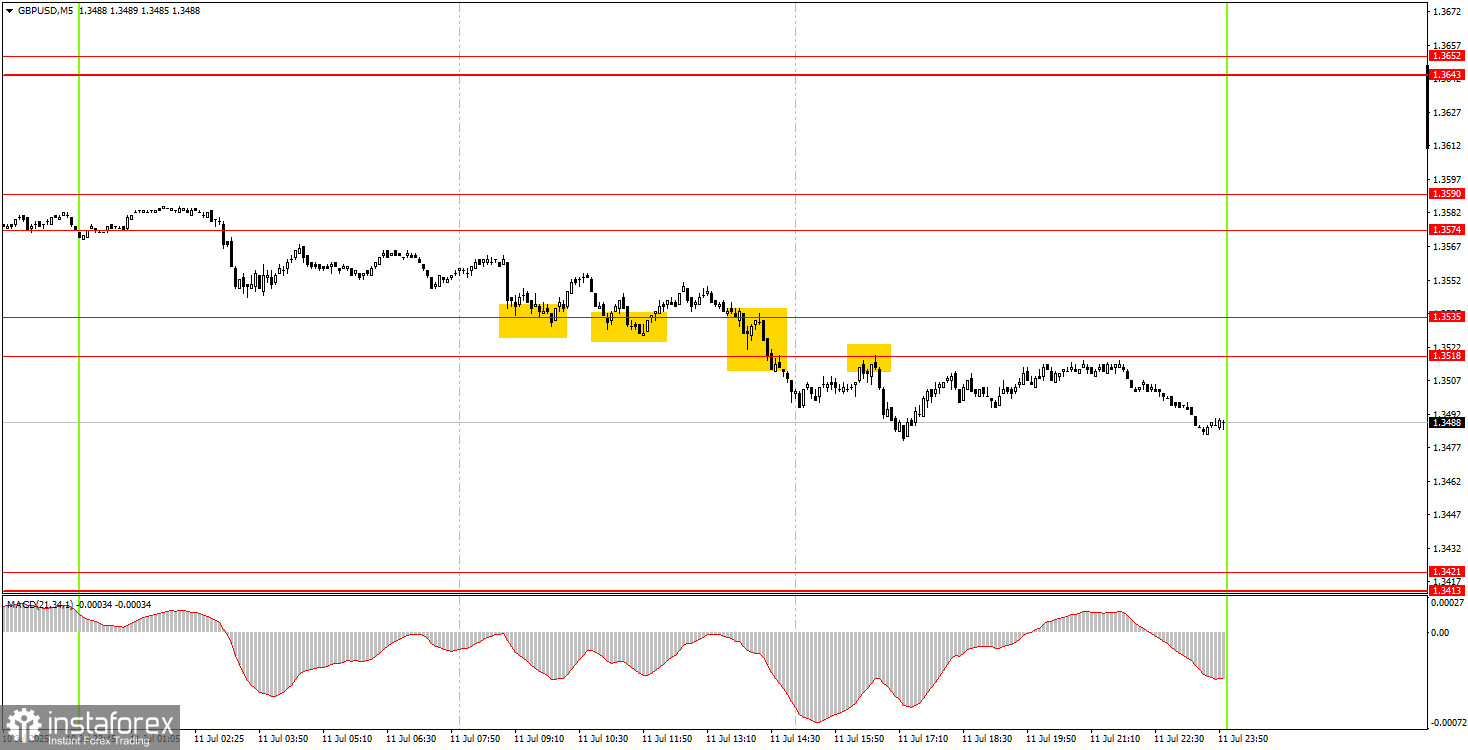
On the 5-minute timeframe Friday, several trading signals were generated. Since the UK data published in the morning was fairly negative for the pound, buy signals could not be a priority. Novice traders may have attempted to work them out, but both rebounds from the 1.3518–1.3535 area turned out to be false. However, the consolidation below this area made it possible to open more attractive short positions.
On the hourly timeframe, the GBP/USD pair plummeted sharply last week, but the dollar's "celebration" ended there. Over the past 7 days, the U.S. dollar has strengthened, but only marginally. We believe the current downward movement is a purely technical correction. This doesn't mean it has to be weak — quite the opposite, it could turn out to be prolonged, and the local trend could change several times during this movement. However, that would only be the case if Donald Trump weren't introducing new tariffs nearly every day. We expect the pair to resume its upward movement, and the technical confirmation would be a break above the descending trend line.
On Monday, the GBP/USD pair may once again trade with a downward bias, as the bearish trend remains in place. A breakout above the trend line would signal its completion.
On the 5-minute timeframe, trading is currently possible using the levels: 1.3203–1.3211, 1.3259, 1.3329–1.3331, 1.3413–1.3421, 1.3518–1.3532, 1.3574–1.3590, 1.3643–1.3652, 1.3682, 1.3763, 1.3814–1.3832. On Monday, no significant events or reports are scheduled in the UK or the U.S., so volatility will likely be low, and the price may remain flat throughout the day.
Support and Resistance Levels: These are target levels for opening or closing positions and can also serve as points for placing Take Profit orders.
Red Lines: Channels or trendlines indicating the current trend and the preferred direction for trading.
MACD Indicator (14,22,3): A histogram and signal line used as a supplementary source of trading signals.
Important Events and Reports: Found in the economic calendar, these can heavily influence price movements. Exercise caution or exit the market during their release to avoid sharp reversals.
Forex trading beginners should remember that not every trade will be profitable. Developing a clear strategy and practicing proper money management are essential for long-term trading success.
Le recensioni analitiche di InstaForex ti renderanno pienamente consapevole delle tendenze del mercato! Essendo un cliente InstaForex, ti viene fornito un gran numero di servizi gratuiti per il trading efficiente.


