empty
 
 
Stai per lasciare
www.instaforex.eu >
il sito gestito da
INSTANT TRADING EU LTD
Apri un conto

18.08.202511:42 Forex Analysis & Reviews: GBP/USD. Technical Analysis for the Week of August 18–23

Queste informazioni sono fornite ai clienti al dettaglio e professionisti come parte della comunicazione di marketing. Non contiene e non deve essere interpretata come contenente consigli di investimento o raccomandazioni di investimento o un'offerta o una sollecitazione a impegnarsi in qualsiasi transazione o strategia in strumenti finanziari. Le performance passate non sono una garanzia o una previsione delle performance future. Instant Trading EU Ltd. non rilascia alcuna dichiarazione e non si assume alcuna responsabilità in merito all'accuratezza o completezza delle informazioni fornite, o qualsiasi perdita derivante da qualsiasi investimento basato su analisi, previsioni o altre informazioni fornite da un dipendente della Società o altri. Il disclaimer completo è disponibile qui.

Trend Analysis.

This week, from the level of 1.3553 (the close of the last weekly candle), the price may start moving downward toward 1.3389 – the 23.6% retracement level (red dashed line). Upon testing this level, the price may rebound upward toward 1.3444 – the 13-period EMA (thin yellow line).

Exchange Rates 18.08.2025 analysis

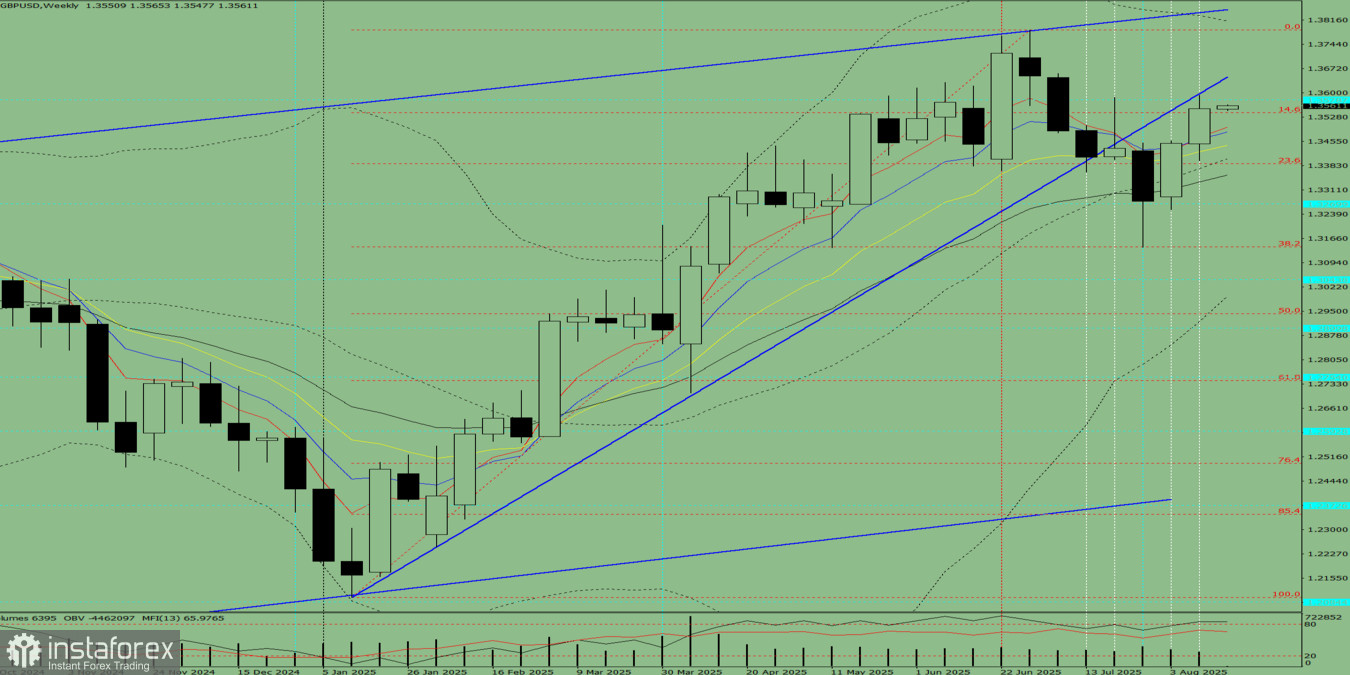
Fig. 1 (weekly chart).

Comprehensive Analysis:

  • indicator analysis – downward;
  • Fibonacci levels – downward;
  • volumes – downward;
  • candlestick analysis – downward;
  • trend analysis – downward;
  • Bollinger Bands – downward;
  • monthly chart – downward.

Conclusion based on comprehensive analysis: downward movement.

Overall result of the weekly candlestick projection for GBP/USD: the price will most likely show a downward trend, with the weekly black candle lacking an initial upper shadow (Monday – downward) and forming a second lower shadow (Friday – upward).

Alternative scenario: From the level of 1.3553 (the close of the last weekly candle), the price may start moving downward toward 1.3270 – the historical support level (blue dashed line). Upon reaching this level, the price may then move upward toward 1.3355 – the 21-period EMA (thin black line).

Eseguito da Stefan Doll
Esperto analista di InstaForex
© 2007-2026

Apri un conto di trading

Le recensioni analitiche di InstaForex ti renderanno pienamente consapevole delle tendenze del mercato! Essendo un cliente InstaForex, ti viene fornito un gran numero di servizi gratuiti per il trading efficiente.


Stai per lasciare www.instaforex.eu, il sito Web gestito da INSTANT TRADING EU LTD
In questo momento non potete parlare al telefono?
Ponete la vostra domanda nella chat.
Widget callback

Turn "Do Not Track" off