empty
 
 
Stai per lasciare
www.instaforex.eu >
il sito gestito da
INSTANT TRADING EU LTD
Apri un conto

03.10.202506:40 Forex Analysis & Reviews: How to Trade the GBP/USD Pair on October 3? Simple Tips and Trade Review for Beginners

Queste informazioni sono fornite ai clienti al dettaglio e professionisti come parte della comunicazione di marketing. Non contiene e non deve essere interpretata come contenente consigli di investimento o raccomandazioni di investimento o un'offerta o una sollecitazione a impegnarsi in qualsiasi transazione o strategia in strumenti finanziari. Le performance passate non sono una garanzia o una previsione delle performance future. Instant Trading EU Ltd. non rilascia alcuna dichiarazione e non si assume alcuna responsabilità in merito all'accuratezza o completezza delle informazioni fornite, o qualsiasi perdita derivante da qualsiasi investimento basato su analisi, previsioni o altre informazioni fornite da un dipendente della Società o altri. Il disclaimer completo è disponibile qui.

Trade Review for Thursday:

1H Chart of GBP/USD

Exchange Rates 03.10.2025 analysis

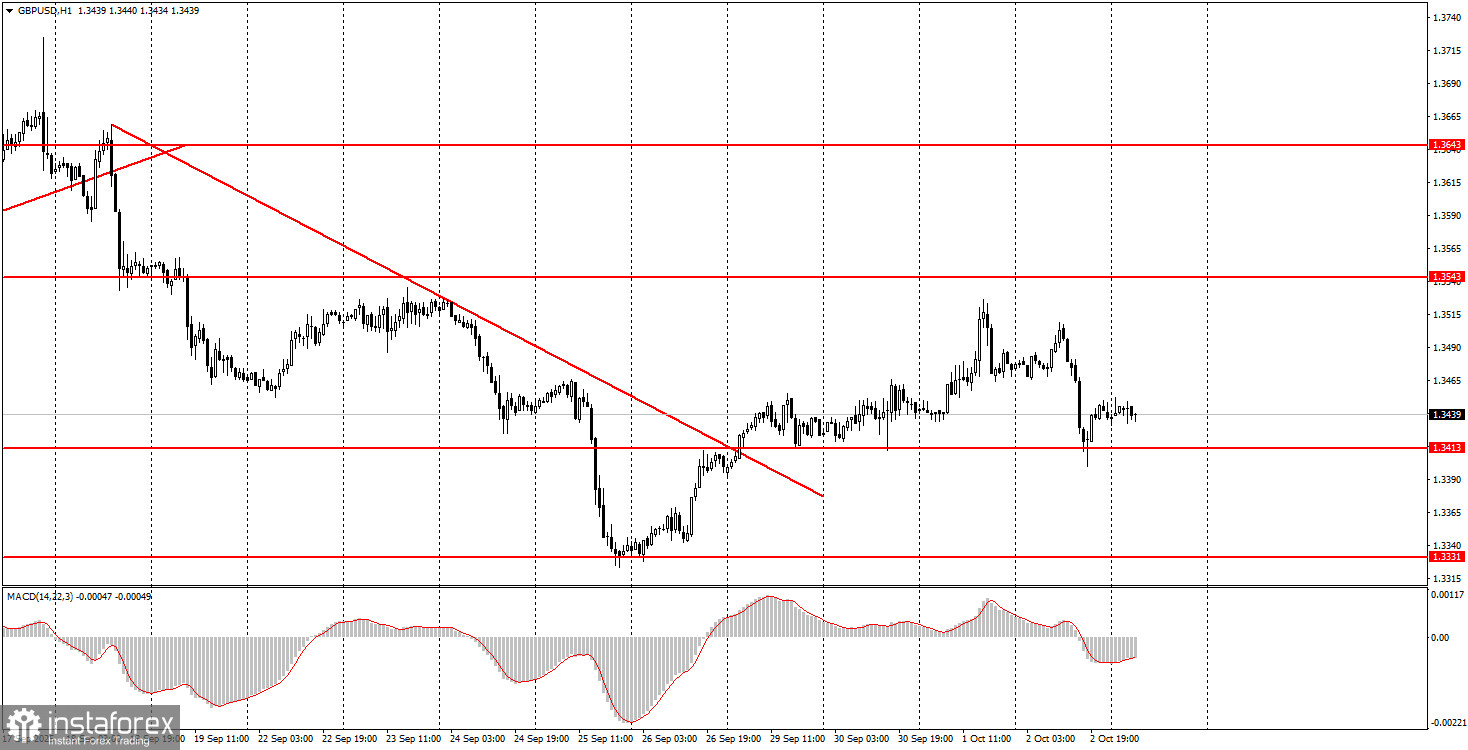
On Thursday, the GBP/USD also showed a downward move, despite the British pound having no real reason to fall. As mentioned earlier, this week's movements in the FX market have been very strange and illogical. Such moves are not rare, and when they do not align with the fundamental or macroeconomic background, the best approach is to acknowledge their illogicality rather than trying to force-fit news or data to explain them.

There were no significant events in the UK or the U.S. yesterday, although earlier this week, at least two events could have triggered a major dollar sell-off—but didn't. That's the main "strangeness" of the current moves. The price failed to consolidate below 1.3413 yesterday, so the upward trend remains intact. Today, however, it's unclear what to expect from U.S. reports, which may not even be released.
5M Chart of GBP/USD

Exchange Rates 03.10.2025 analysis

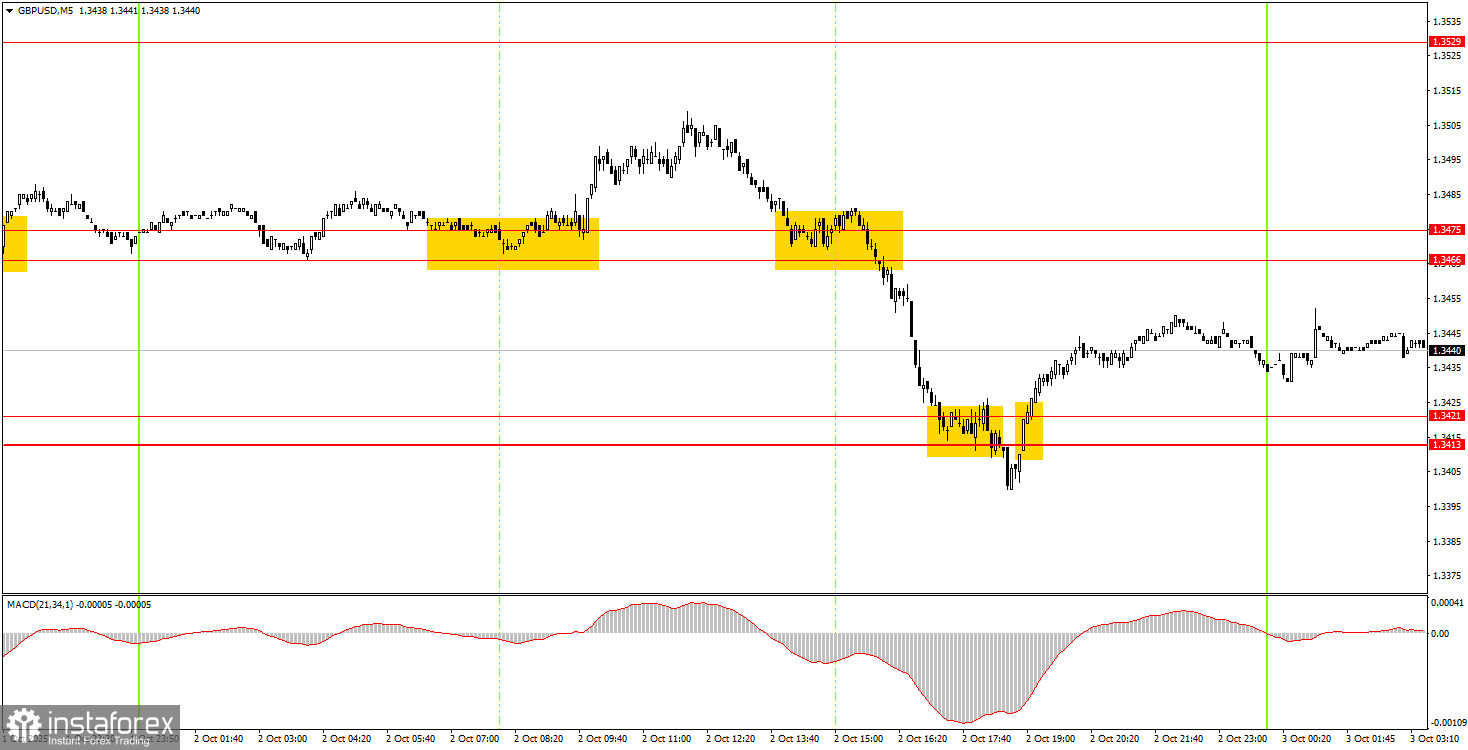
On the 5-minute timeframe, there were several signals yesterday. First, the pair rebounded from the 1.3466–1.3475 zone, then broke above it, and later generated a buy signal near the 1.3413–1.3421 area. The last signal came relatively late, but the first two could be traded. In the first case, the 1.3529 target wasn't reached, while in the second, it was. Thus, at least one trade could have been closed with a solid profit

How to Trade on Friday:

On the hourly chart, GBP/USD has completed the formation of its downtrend. As noted earlier, there are no reasons for prolonged dollar strength, so in the medium term, we expect only upward movement. Recent events in the UK and the U.S. have temporarily supported the dollar, but the global fundamental background remains negative for it, and the downtrend is already over.

On Friday, GBP/USD may continue its upward move. A rebound from 1.3413–1.3421 allows opening longs targeting 1.3466–1.3475 and higher. A consolidation below 1.3413–1.3421 would make shorts toward 1.3329–1.3331 relevant.

On the 5M chart, the following levels to trade from are: 1.3102–1.3107, 1.3203–1.3211, 1.3259, 1.3329–1.3331, 1.3413–1.3421, 1.3466–1.3475, 1.3529–1.3543, 1.3574–1.3590, 1.3643–1.3652, 1.3682, and 1.3763. No key events are scheduled in the UK on Friday. In the U.S., the ISM Services PMI will be released, while Non-Farm Payrolls and unemployment data are unlikely to be released.

Basic Rules of the Trading System:

  1. The strength of a signal depends on how quickly it forms (rebound or breakout). The less time needed, the stronger the signal.
  2. If two or more false signals form near a level, ignore subsequent signals from that level.
  3. In flat conditions, pairs may produce many false signals or none at all. At the first signs of flat, stop trading.
  4. Open trades between the start of the European session and the middle of the U.S. session; close all positions manually after that.
  5. On the 1H chart, trade MACD signals only when volatility is sufficient and the trend is confirmed by a trendline or channel.
  6. Levels close together (5–20 pips apart) should be considered a support or resistance zone.
  7. After the price moves 20 pips in the right direction, set the Stop Loss to breakeven.

What's on the Charts:

  • Support/resistance levels – targets for buy/sell trades, and potential Take Profit levels.
  • Red lines – trendlines or trend channels indicating the current trend and trading direction.
  • MACD (14,22,3) – histogram and signal line, used as an additional source of signals.
  • Important speeches and reports (always included in the news calendar) can have a significant impact on currency pair movements. Therefore, when they are released, it is recommended to trade with extreme caution or exit the market to avoid a sharp reversal of prices against the previous movement.
  • Beginners trading on the Forex market should remember that not every trade can be profitable. Developing a clear strategy and money management are the keys to success in trading over a long period of time.
Eseguito da Paolo Greco
Esperto analista di InstaForex
© 2007-2026

Apri un conto di trading

Le recensioni analitiche di InstaForex ti renderanno pienamente consapevole delle tendenze del mercato! Essendo un cliente InstaForex, ti viene fornito un gran numero di servizi gratuiti per il trading efficiente.


Stai per lasciare www.instaforex.eu, il sito Web gestito da INSTANT TRADING EU LTD
In questo momento non potete parlare al telefono?
Ponete la vostra domanda nella chat.
Widget callback

Turn "Do Not Track" off