 Rimani
Condizioni di trading
Strumenti

Trend Analysis (Fig. 1).
On Friday, from the level of 1.1556 (yesterday's daily candle close), the market may continue to move downward toward the target of 1.1529 – the lower boundary of the Bollinger Bands indicator (black dotted line). When testing this line, a pullback upward is possible with a target of 1.1556 – the historical support level (blue dotted line).
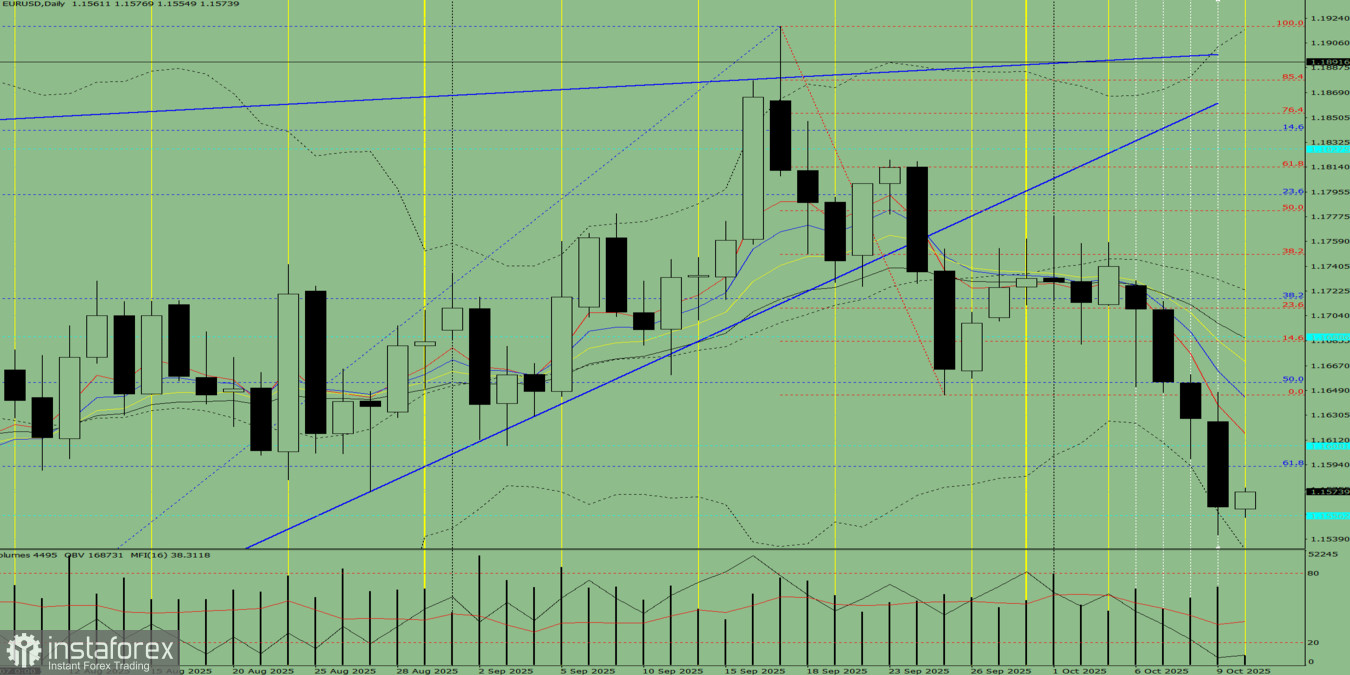
Fig. 1 (daily chart).
Comprehensive Analysis:
General conclusion: downward trend.
Alternative scenario: Today, from the level of 1.1556 (yesterday's daily candle close), the price may continue to move downward with a target of 1.1542 – the lower fractal (daily candle from October 9, 2025). When testing this level, a pullback upward is possible with a target of 1.1556 – the historical support level (blue dotted line).
Le recensioni analitiche di InstaForex ti renderanno pienamente consapevole delle tendenze del mercato! Essendo un cliente InstaForex, ti viene fornito un gran numero di servizi gratuiti per il trading efficiente.


