 Rimani
Condizioni di trading
Strumenti


The GBP/USD currency pair also pretended to trade on Monday. The day began quite optimistically, with a 30-pip rise. One could assume that the market was indeed set to react to the de-escalation of the trade conflict between China and the U.S. It does not matter that such de-escalation should have led to an appreciation of the dollar rather than a decline. Traders want to see movement, not just convulsions. However, a couple of hours later, it became clear that the 30-pip increase in the morning was merely a coincidence. Throughout the day, no interesting reports were released in the UK or the U.S., and no other news came to traders' attention.
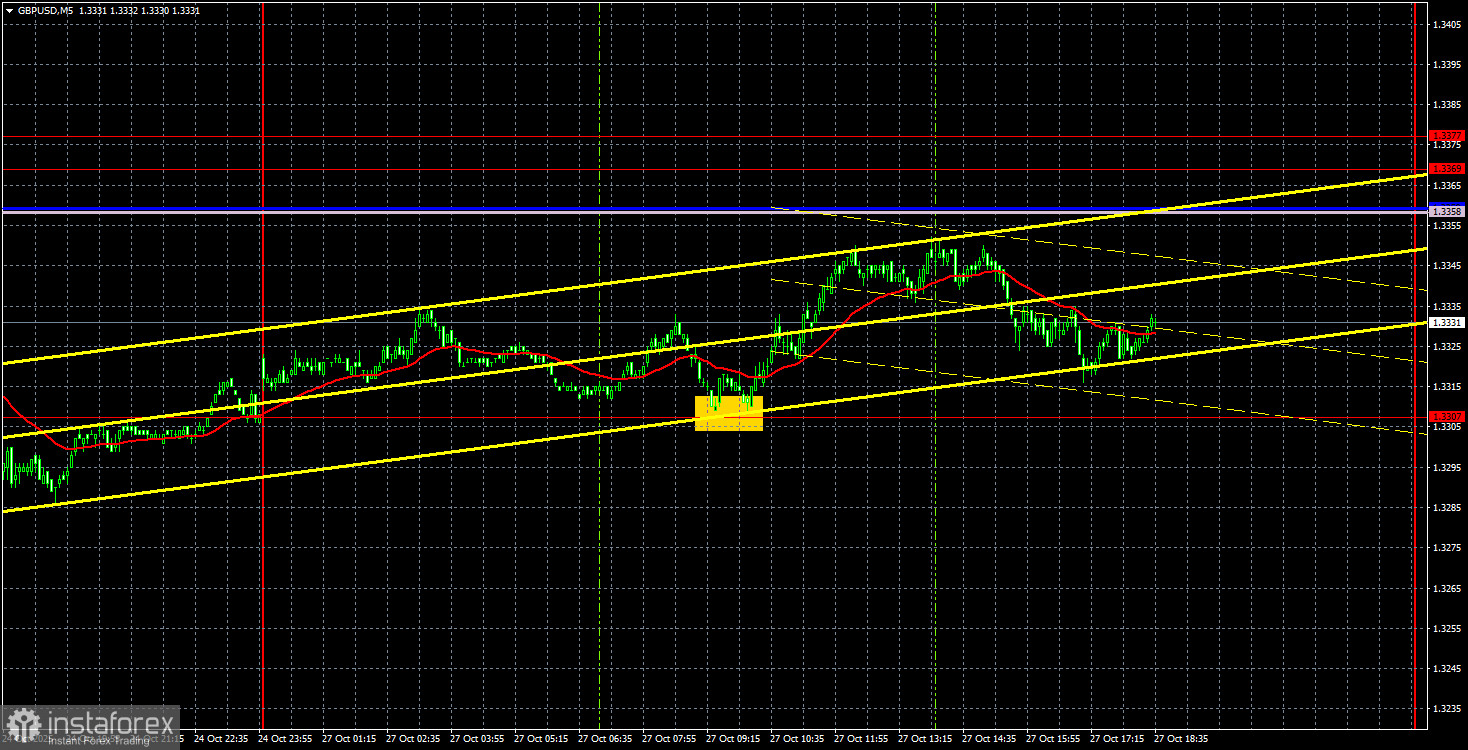
From a technical standpoint, nothing is changing. The market has been in a flat for the past four months, and now a flat has formed on the hourly timeframe as well, between levels 1.3307 and 1.3369. Thus, we now have a flat within a flat – a "flash royal" for traders. Volatility remains minimal, with no movements. There is virtually nothing to discuss.
On the 5-minute timeframe, somewhat miraculously, the pair generated one buy signal, allowing traders to earn a few dozen points. To be precise, about 10-15 pips. The price bounced off the 1.3307 level during the European trading session. It bounced quite accurately, and since this is the lower line of the sideways channel, one could consider going long. By the end of the day, the upper line of the flat was not reached, but the price still crawled up by a couple of dozen pips.
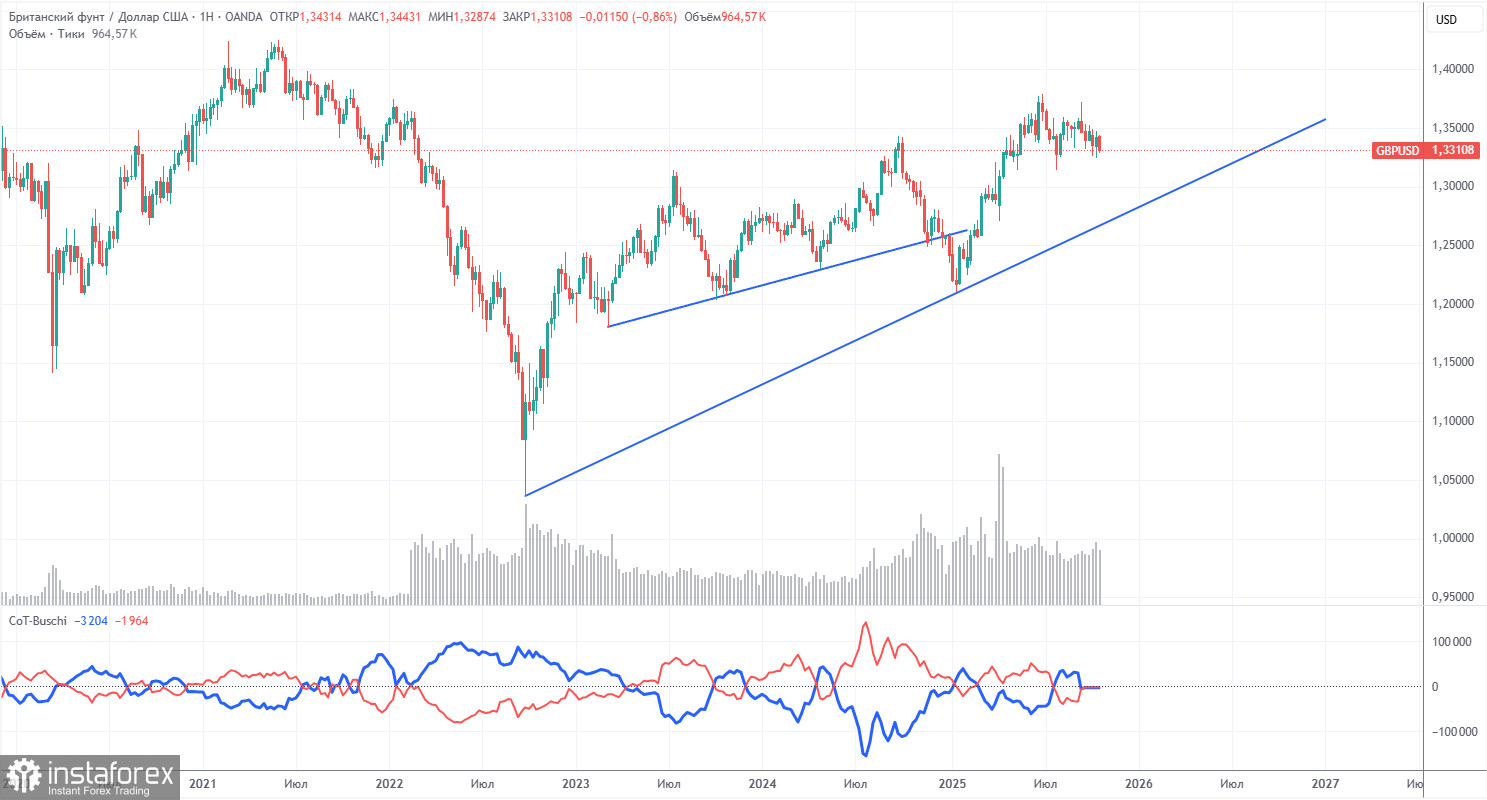
COT reports for the British pound indicate that, in recent years, commercial traders' sentiment has been constantly changing. The red and blue lines, representing the net positions of commercial and non-commercial traders, frequently intersect and are mainly close to the zero mark. Currently, they are nearly at the same level, indicating roughly equal numbers of buy and sell positions.
The dollar continues to decline due to Donald Trump's policies, so, in principle, the market makers' demand for the pound sterling is not particularly significant at this moment. The trade war will continue in one form or another for a long time. The Federal Reserve will likely lower rates regardless in the coming year. Demand for the dollar will decline one way or another. According to the latest COT report for the British pound, the "Non-commercial" group opened 3,700 BUY contracts and closed 900 SELL contracts. Thus, the net position of non-commercial traders increased by 4,600 contracts over the week.
In 2025, the pound rose significantly, but it should be understood that there is only one reason: Donald Trump's policies. Once this reason is mitigated, the dollar could start appreciating, but when that will happen is anyone's guess. Regardless of how rapidly the net position for the pound increases or decreases, the net position for the dollar is consistently declining, and typically at a higher pace.
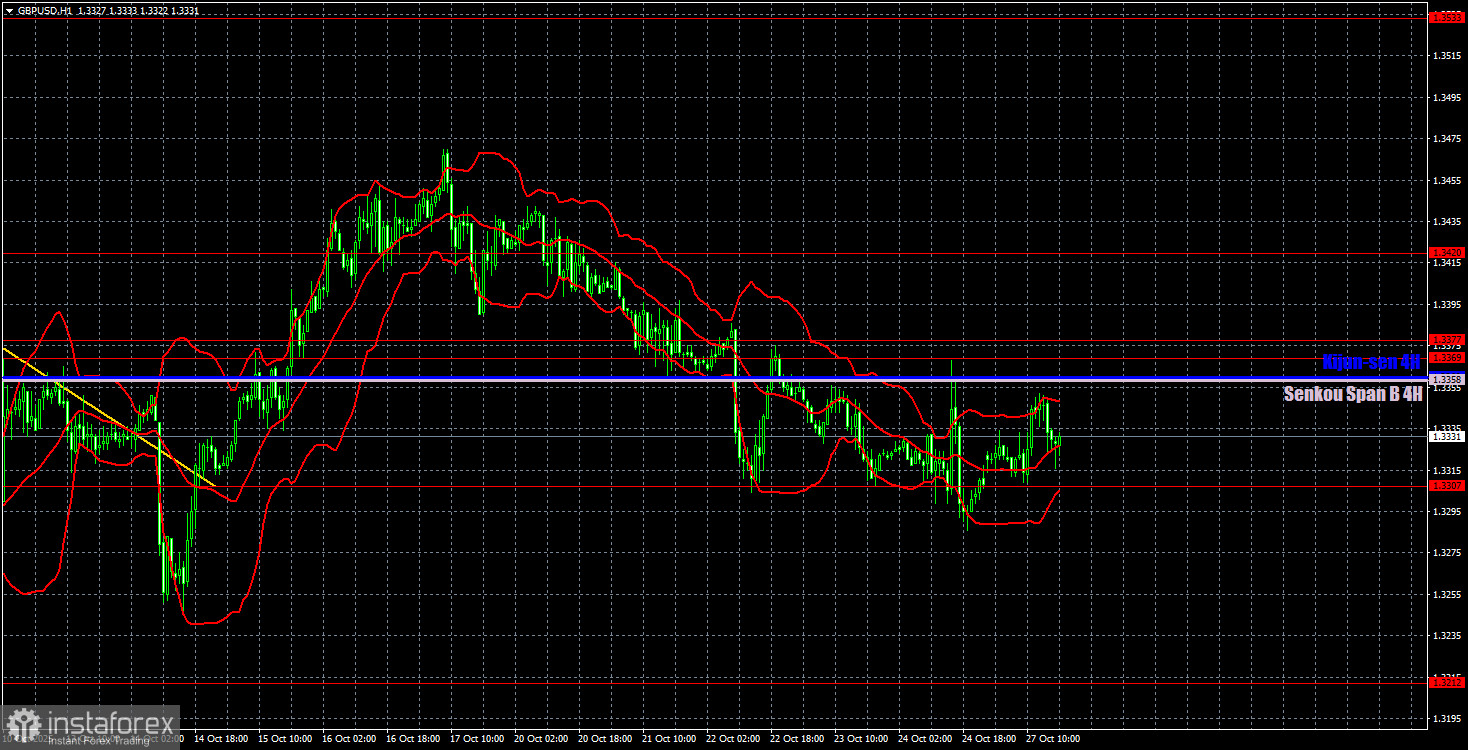
On the hourly timeframe, the GBP/USD pair has finally completed its downward trend and has begun a new upward one. However, it started this upward trend two weeks ago, and since then, the pound has been falling much more than it has been rising. Still, the upward trend has not been canceled. For the upward trend to resume, it is necessary to at least overcome the Senkou Span B and Kijun-sen lines. The dollar still lacks global reasons to strengthen, so we expect the pair to rise towards the 2025 highs virtually regardless of circumstances. The key point is to end the flat on the daily timeframe as soon as possible.
For October 28, we highlight the following important levels: 1.3125, 1.3212, 1.3307, 1.3369-1.3377, 1.3420, 1.3533-1.3548, 1.3584, 1.3681, 1.3763, 1.3833, 1.3886. The Senkou Span B (1.3358) and Kijun-sen (1.3359) lines may also serve as sources of signals. It is recommended to place a Stop Loss at breakeven once the price moves in the correct direction by 20 pips. The Ichimoku indicator lines may shift during the day, which should be taken into account when determining trading signals.
On Tuesday, there are no significant or interesting events scheduled in the UK or the U.S., so volatility may again equal "zero." The flat is likely to persist even on the hourly timeframe.
Price support and resistance levels are depicted as thick red lines around which price movement may occur. They are not sources of trading signals.
The Kijun-sen and Senkou Span B lines are Ichimoku indicator lines that have been transferred from the 4-hour timeframe to the hourly timeframe. They are strong lines.
Extreme levels are shown as thin red lines, from which the price previously bounced. They are sources of trading signals.
Yellow lines indicate trend lines, trend channels, and any other technical patterns.
Indicator 1 on the COT charts represents the net position size for each category of traders.
Le recensioni analitiche di InstaForex ti renderanno pienamente consapevole delle tendenze del mercato! Essendo un cliente InstaForex, ti viene fornito un gran numero di servizi gratuiti per il trading efficiente.


