 Rimani
Condizioni di trading
Strumenti


The EUR/USD currency pair traded very weakly on Friday. This is not surprising, as Christmas and New Year celebrations are ongoing worldwide. With more holidays, traders had less motivation to open positions, and there was no macroeconomic or fundamental backdrop. Therefore, strong and trending movements are unlikely until the end of the year. This week, the economic calendar for the Eurozone and the U.S. is empty.
From a technical standpoint, the upward trend remains on the hourly timeframe, as evidenced by the trend line. We consider the primary task for the euro this week to stay above this trend line to continue rising at the start of the new year. The euro is also supported by the Ichimoku indicator lines. A bounce from the area of 1.1750-1.1760 today could provoke a slight rise in the pair.
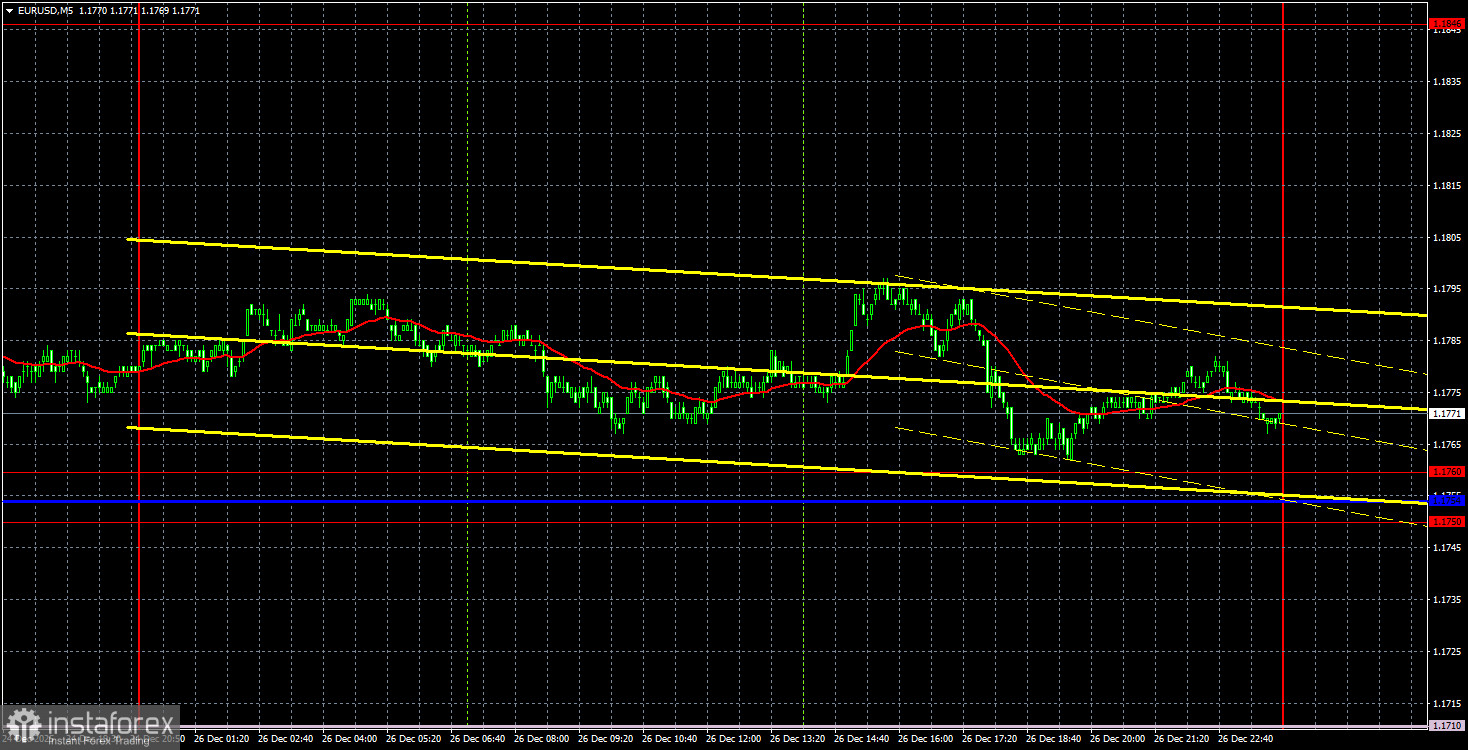
On the 5-minute chart, no trading signals were formed on Friday, and the price remained predominantly sideways throughout the day. Traders had no grounds to open trading positions.
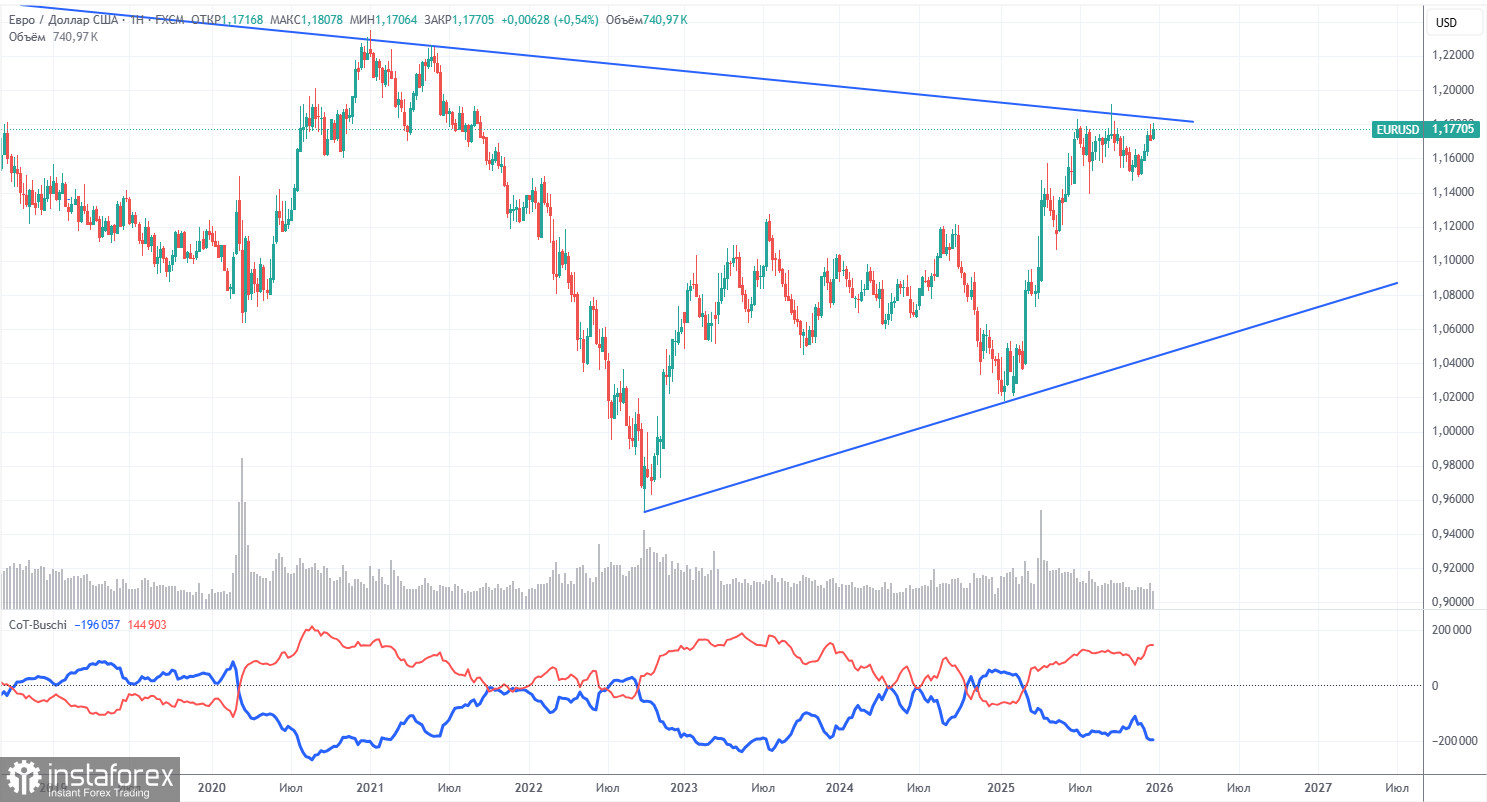
The latest COT report is dated December 16. The illustration above clearly shows that the net position of non-commercial traders has been bullish for a long time, with bears struggling to gain supremacy at the end of 2024, but quickly losing it. Since Trump took office as president of the United States for a second time, only the dollar has been declining. While we cannot say with 100% certainty that the dollar's decline will continue, current global developments suggest this is a possibility. The red and blue lines are moving further apart, indicating a strong advantage for the bulls.
We still do not see any fundamental factors that would strengthen the euro, but there are plenty of factors supporting a decline in the dollar. The global downward trend remains intact, but what does it matter where the price has moved over the last 17 years? For the past three years, only the euro has been appreciating, which is also a trend.
The positioning of the red and blue lines in the indicator continues to signal the preservation and strengthening of the bullish trend. During the last reporting week, the number of long positions in the "Non-commercial" group increased by 8,900, while the number of short positions rose by 2,700. Accordingly, the net position increased by 6,200 contracts over the week.
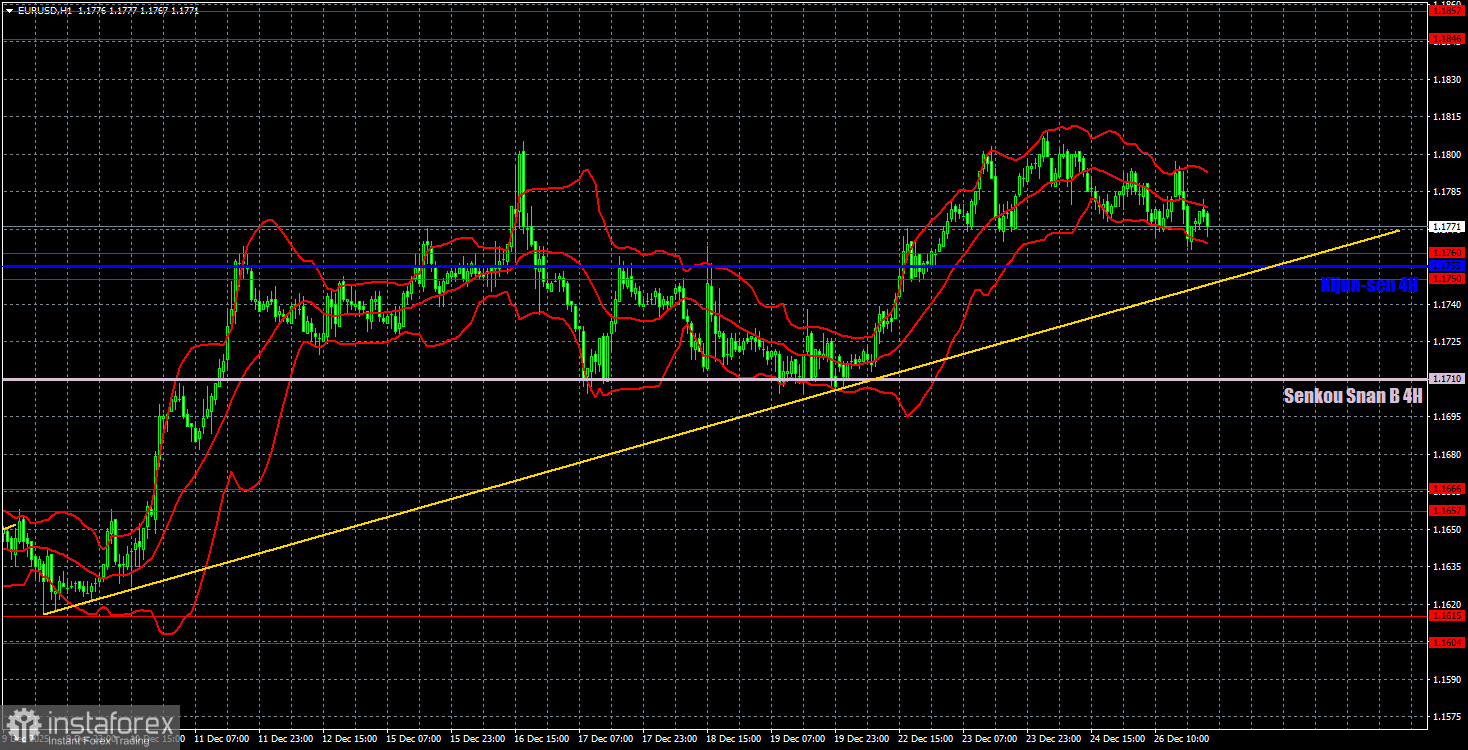
On the hourly timeframe, the EUR/USD pair continues to build a bullish trend. In fact, the upper boundary of the 1.1400-1.1830 range has been tested twice, so we might soon see a technical decline, as the flat persists on the daily timeframe. However, the area of 1.1750-1.1760 is preventing the pair from dropping lower, which means that bulls can make another attempt to break through the upper boundary of the range at any moment.
For December 29, we highlight the following important levels: 1.1234, 1.1274, 1.1362, 1.1426, 1.1542, 1.1604-1.1615, 1.1657-1.1666, 1.1750-1.1760, 1.1846-1.1857, 1.1922, 1.1971-1.1988, as well as the Senkou Span B line (1.1710) and Kijun-sen (1.1755). The Ichimoku indicator lines may shift during the day, which should be taken into account when determining trading signals. Don't forget to set a Stop Loss at breakeven if the price moves in the correct direction by 15 pips. This will protect against possible losses if the signal turns out to be false.
On Monday, no significant events or reports are scheduled in the Eurozone or the U.S. Movement may be weak during the day and trendless.
On Monday, traders may trade in the 1.1750-1.1760 range. A price bounce from this area will make long positions relevant, with a target in the 1.1800-1.1830 range. A break below this area will lead to a decline toward the Senkou Span B line.
Le recensioni analitiche di InstaForex ti renderanno pienamente consapevole delle tendenze del mercato! Essendo un cliente InstaForex, ti viene fornito un gran numero di servizi gratuiti per il trading efficiente.


