 Rimani
Condizioni di trading
Strumenti


The EUR/USD currency pair showed nervous, mixed movements on Wednesday, but recall that it was December 31. That says it all. For obvious reasons, there were no macroeconomic or fundamental events that day in either the US or the Eurozone; the market closed in the evening and reopened only last night, then closed again in the evening for the weekend. Essentially, the holidays are over, but the holidays continue. Formally, the price this week breached the ascending trendline, but we do not treat this as a trend change. EUR/USD continues to trade near the upper boundary of the sideways channel on the daily timeframe, between 1.1400 and 1.1830. Very soon (when the market fully "recovers" from the holidays), we expect a new test of this area. Next week, traders will begin receiving macroeconomic data, so moves may become stronger and more attractive.
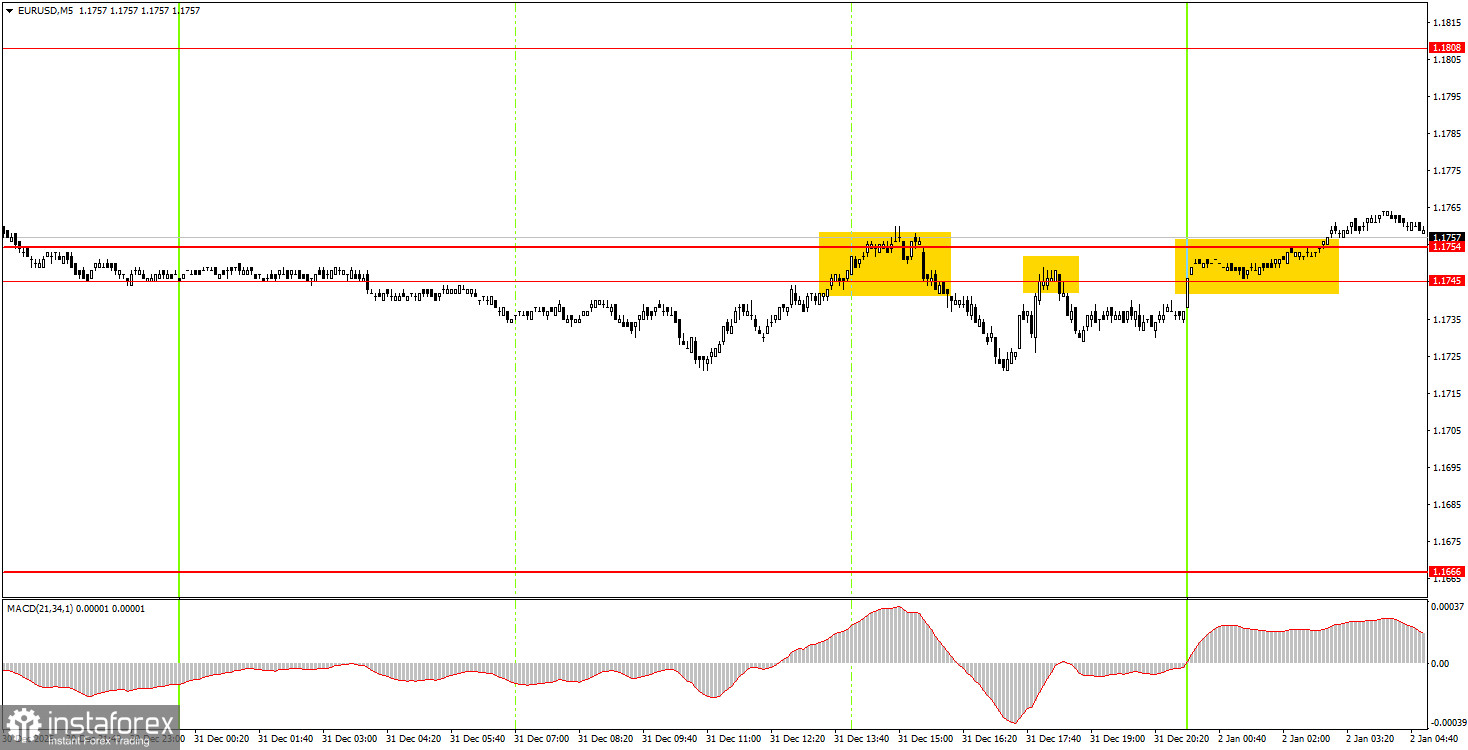
On the 5-minute timeframe, two sell trade signals were formed on Wednesday in the form of two rebounds from the 1.1745–1.1755 area. Beginner traders could have reasonably traded those signals if they had wished to open trades several hours before market close and before the New Year. Last night, the pair broke through the 1.1745–1.1755 area, which is a buy signal. However, moves today may again be very weak, so we do not expect strong euro growth.
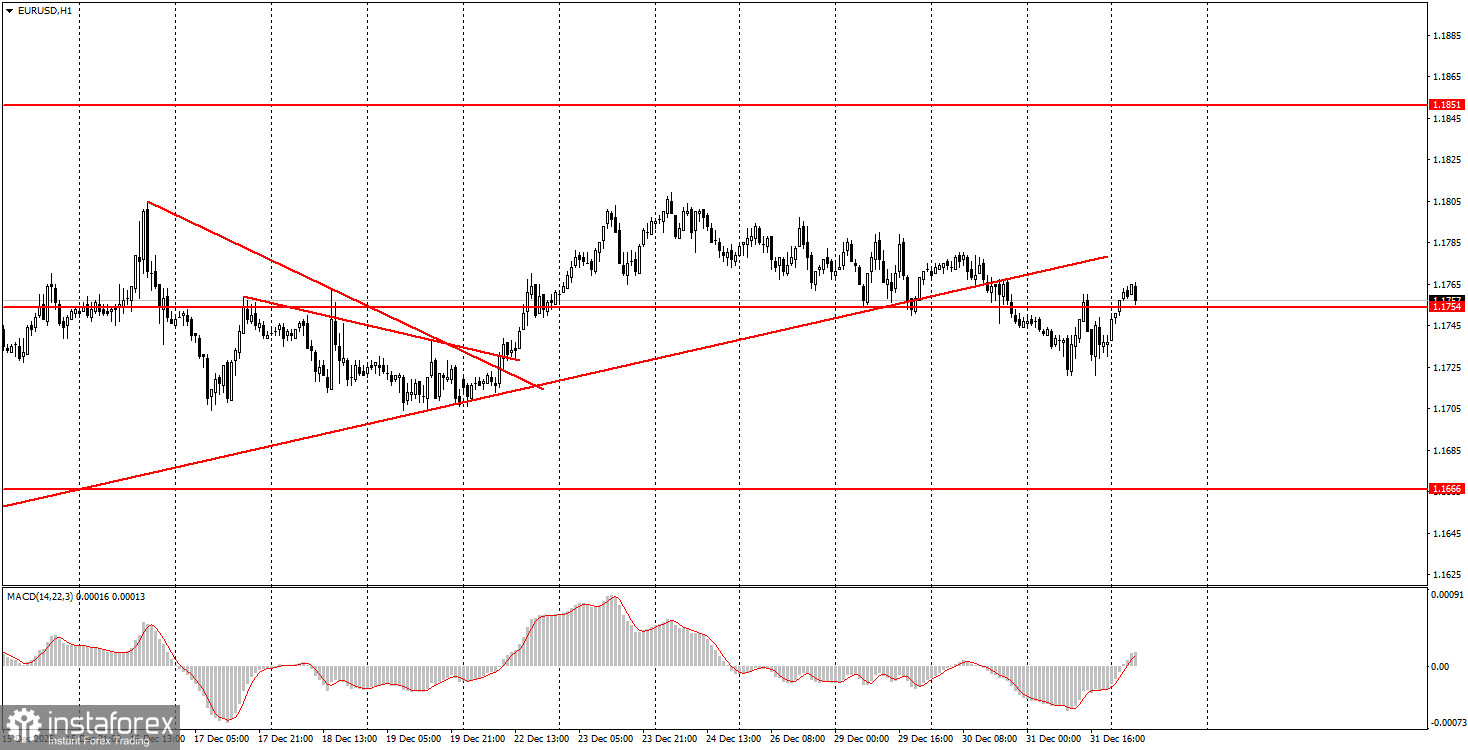
On the hourly timeframe, EUR/USD continues forming an uptrend despite the trendline breach. The price may soon retest the 1.1800–1.1830 area, which is the upper boundary of the daily flat. It is quite possible that this time we will see an exit from the six-month sideways channel. The overall fundamental and macroeconomic backdrop remains very weak for the US dollar; therefore, we expect the pair to rise in the medium term.
On Friday, beginner traders can trade from the 1.1745–1.1754 area. A close above this area allows opening long positions with a target of 1.1808. A close below this area allows opening shorts with a target of 1.1666.
On the 5-minute timeframe, consider the levels 1.1354–1.1363, 1.1413, 1.1455–1.1474, 1.1527–1.1531, 1.1550, 1.1584–1.1591, 1.1655–1.1666, 1.1745–1.1754, 1.1808, 1.1851, 1.1908, 1.1970–1.1988. No important events or releases are scheduled in the EU or the US for Friday. Thus, we may again face very weak moves today.
Support and resistance price levels — levels that serve as targets when opening buys or sells. Take Profit levels can be placed near them.
Red lines — channels or trendlines that display the current tendency and show the preferred trading direction.
MACD indicator (14,22,3) — histogram and signal line — an auxiliary indicator that can also be used as a source of signals.
Important speeches and reports (always included in the news calendar) can significantly affect the movement of the currency pair. Therefore, during their release, one should trade as cautiously as possible or exit the market to avoid a sharp reversal of price against the prior move.
Beginner forex traders should remember that not every trade can be profitable. Developing a clear strategy and sound money management are the keys to long-term success in trading.
Le recensioni analitiche di InstaForex ti renderanno pienamente consapevole delle tendenze del mercato! Essendo un cliente InstaForex, ti viene fornito un gran numero di servizi gratuiti per il trading efficiente.


