 Rimani
Condizioni di trading
Strumenti


GBP/USD
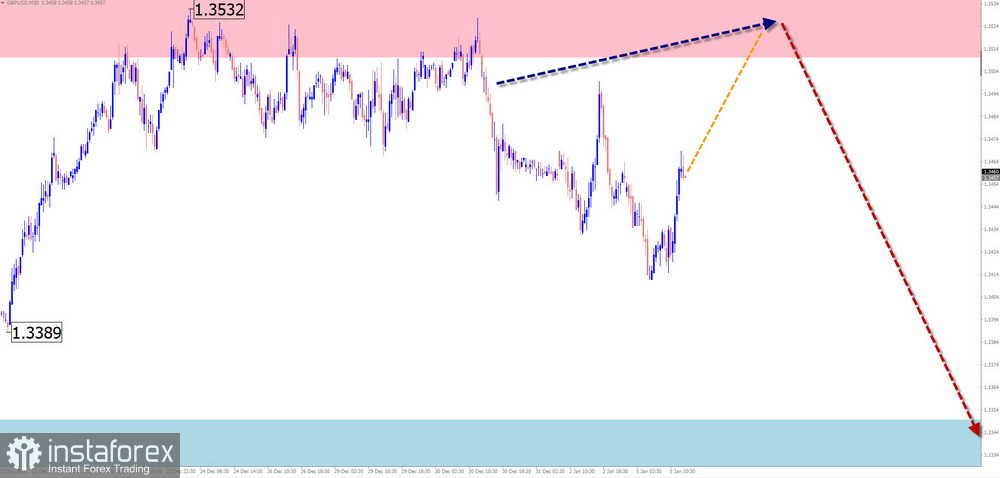
On the British pound chart, the dominant upward wave that has been in place since January of last year continues, with its final segment (C) having begun two months ago. The structure of this wave segment does not yet appear complete. At the time of analysis, price is located near the upper boundary of a large-scale potential reversal zone.
Throughout the coming week, a continuation of the overall sideways movement of the British currency is expected, within a price corridor between opposing zones. After an attempt to pressure the resistance zone, a change in direction and a decline toward the projected support zone can be anticipated. The greatest activity is likely toward the end of the week.
Resistance:
Support:
AUD/USD
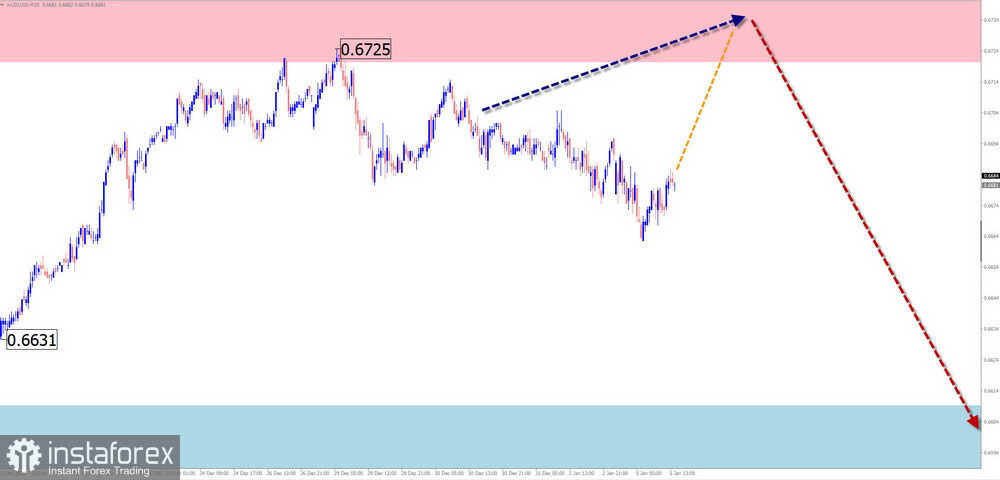
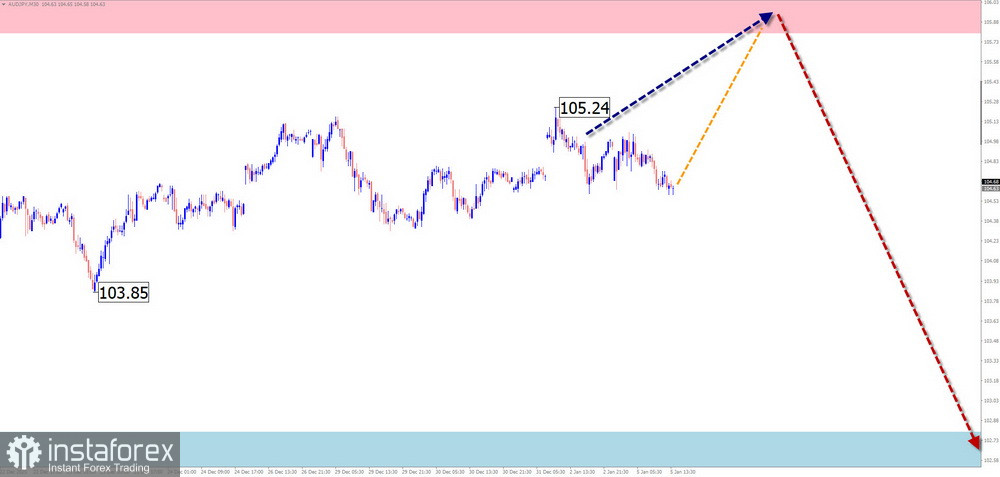
On the main Australian dollar pair, a bullish wave has been developing since April of last year, defining the general direction of short-term price fluctuations. Within the upward segment that began on November 21, the middle part (B) has been forming over the past three weeks as a shifting flat. Its structure still lacks the final segment.
In the coming days, a continuation of the overall sideways tone can be expected. At the beginning of the week, an upward move is likely, with price rising toward the projected resistance area. Closer to the weekend, the probability of a reversal and the start of a downward move toward the support zone increases.
Resistance:
Support:
USD/CHF
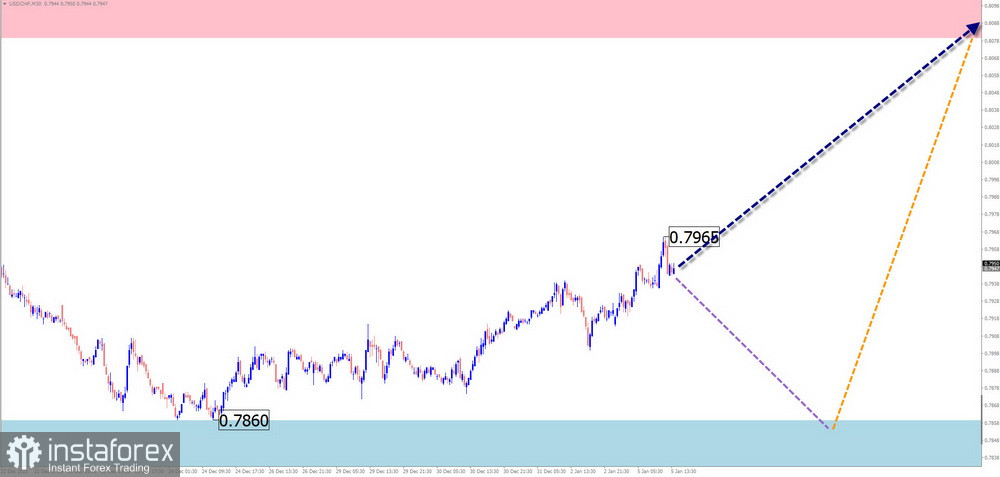
On the Swiss franc chart, the main direction of movement is set by an upward wave that began in April of last year. The wave structure forms an extended/shifting flat and does not yet appear complete. Price is located near the upper boundary of a potential reversal zone. No clear signals of an imminent reversal are currently observed.
Over the coming week, predominantly sideways price action is expected. In the first half of the week, sideways movement near the support zone is more likely. Closer to the weekend, a reversal and resumption of upward movement can be anticipated.
Resistance:
Support:
EUR/JPY
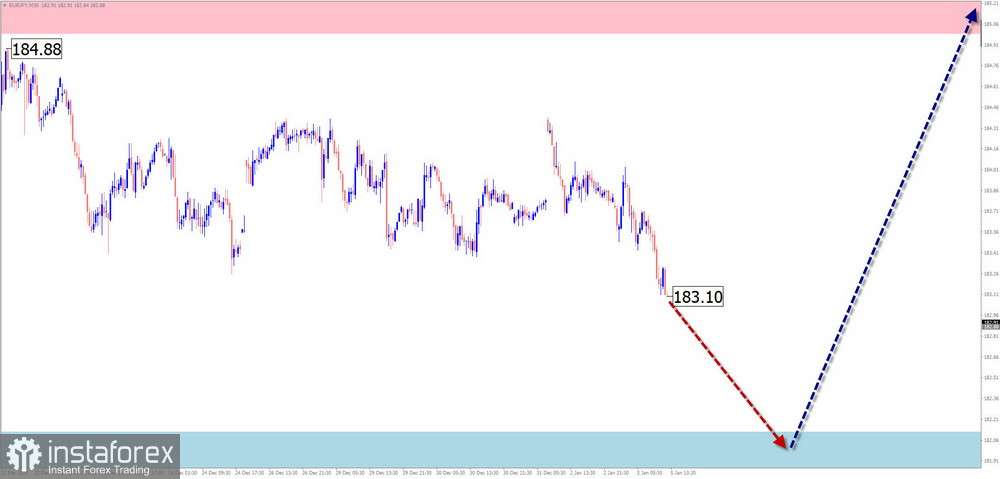
On the EUR/JPY pair, an upward wave has been developing since February of last year, nearing the end of a bullish trend on a higher timeframe. At present, the wave structure does not look complete. Over the past two weeks, price has been correcting mainly sideways, forming an extended flat that remains unfinished at the time of analysis.
During the current week, price is expected to move within a sideways channel between opposing zones. In the first days, a decline toward the projected support is more likely. After that, a reversal and upward movement can be expected. During the change in direction, a brief break below the lower boundary of the price corridor cannot be ruled out.
Resistance:
Support:
AUD/JPY
The direction of short-term price movements in the AUD/JPY pair since April of last year has been defined by an upward wave. Its currently unfinished segment began in mid-October. Price is trading within a potential reversal zone on the daily timeframe, approaching its upper boundary. No clear signals of an imminent trend change are observed.
At the beginning of the coming week, a continuation of sideways movement can be expected. Further growth and pressure on the resistance zone are likely. A brief break above its upper boundary cannot be ruled out. After that, a change in direction and a decline in the cross rate can be expected.
Resistance:
Support:
EUR/CHF
On the EUR/CHF pair, the direction of price movement since March of last year has been defined by a bearish wave. Within the wave structure, the final part of the corrective phase (B) has been developing since mid-November. During the pullback, price has approached a large-scale support level on the chart.
In the first days of the coming week, a continuation of the downward movement of the pair can be expected, potentially completing near the projected support area. After contact with the reversal zone, a change in direction and the start of price growth can be anticipated. The boundaries of weekly volatility are defined by the projected opposing zones.
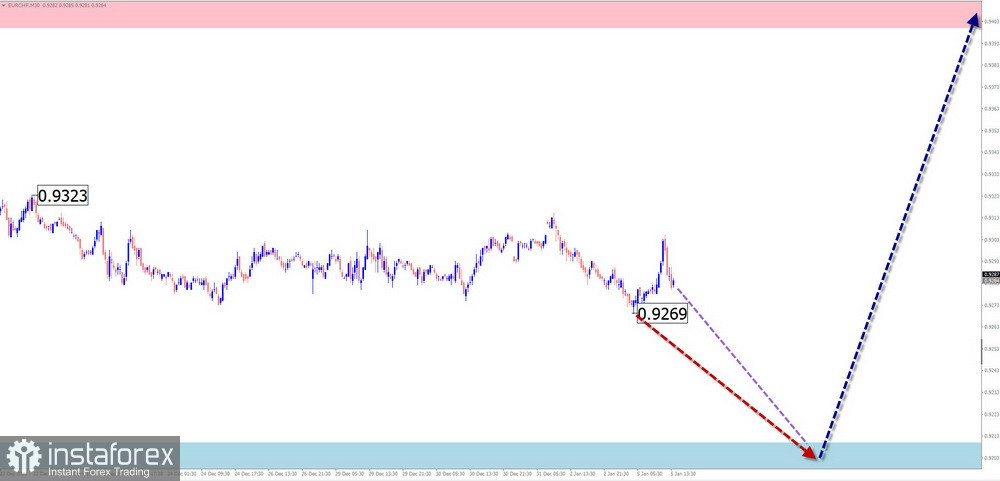
Resistance:
Support:
Notes:
In simplified wave analysis (SWA), all waves consist of three parts (A–B–C). On each timeframe, the last unfinished wave is analyzed. Dotted lines indicate expected movements.
The wave algorithm does not take into account the duration of price movements over time.
Le recensioni analitiche di InstaForex ti renderanno pienamente consapevole delle tendenze del mercato! Essendo un cliente InstaForex, ti viene fornito un gran numero di servizi gratuiti per il trading efficiente.


