 Rimani
Condizioni di trading
Strumenti


On Thursday, the EUR/USD pair continued to decline and reached the support level of 1.1645–1.1648. A rebound from this zone today would favor the European currency and lead to a moderate rise toward the corrective levels of 38.2% – 1.1686 and 23.6% – 1.1731. A consolidation below the 1.1645–1.1648 level would increase the likelihood of a further decline toward the next support level at 1.1607–1.1612 and the Fibonacci level of 76.4% – 1.1566.
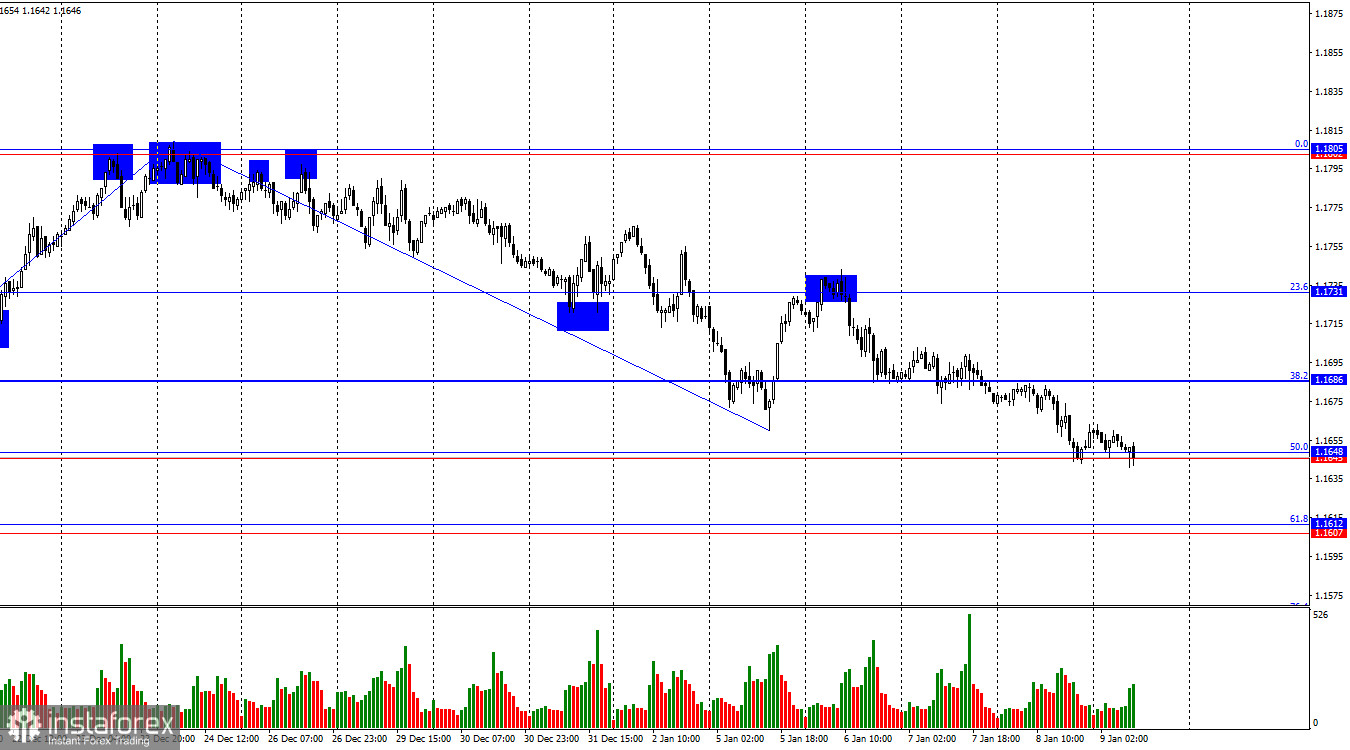
The wave structure on the hourly chart remains straightforward. The most recently completed upward wave failed to break the peak of the previous wave, while the new downward wave broke the previous low. Thus, the trend remains bearish. In my view, the decline in the pair will not be prolonged or strong, but a breakdown of the current bearish trend is now required in order to expect a new rise in the euro. Based on the current chart setup, such a reversal would occur above the resistance level of 1.1795–1.1802 or after two consecutive bullish waves.
On Thursday, traders had very few news drivers compared to Wednesday. However, if you look at the chart, you will likely reach the same conclusion as I did—the price movements over these two days are almost identical. On Wednesday, two out of three U.S. reports came in weaker than traders expected, yet the dollar still strengthened. Therefore, it is currently very difficult to say what exactly is driving the bears' attacks. And if they do have solid reasons, what are they, and why are these attacks so weak? These questions are largely rhetorical.
Yesterday, Donald Trump stated that the next U.S. military target could be Mexico. Let me remind you that Mexico is not the only country on Trump's latest "blacklist," as in 2026 we have already heard threats directed at Cuba and Colombia, as well as claims involving Greenland. Trump believes that Mexico is ruled by cartels and that it is time to put an end to this. I do not believe that the U.S. dollar is rising due to geopolitical tensions in North and Central America. The dollar is rising very weakly and for unclear reasons, but it is still rising. Today, the focus is on Nonfarm Payrolls and the unemployment rate.

On the 4-hour chart, the pair has returned to the support level of 1.1649–1.1680. Another rebound from this zone would favor the EU currency and a moderate rise toward the 0.0% corrective level at 1.1829. A consolidation below the 1.1649–1.1680 support zone would increase the chances of a continued decline toward the next Fibonacci level of 38.2% – 1.1538. No emerging divergences are observed on any indicators today.
Commitments of Traders (COT) Report
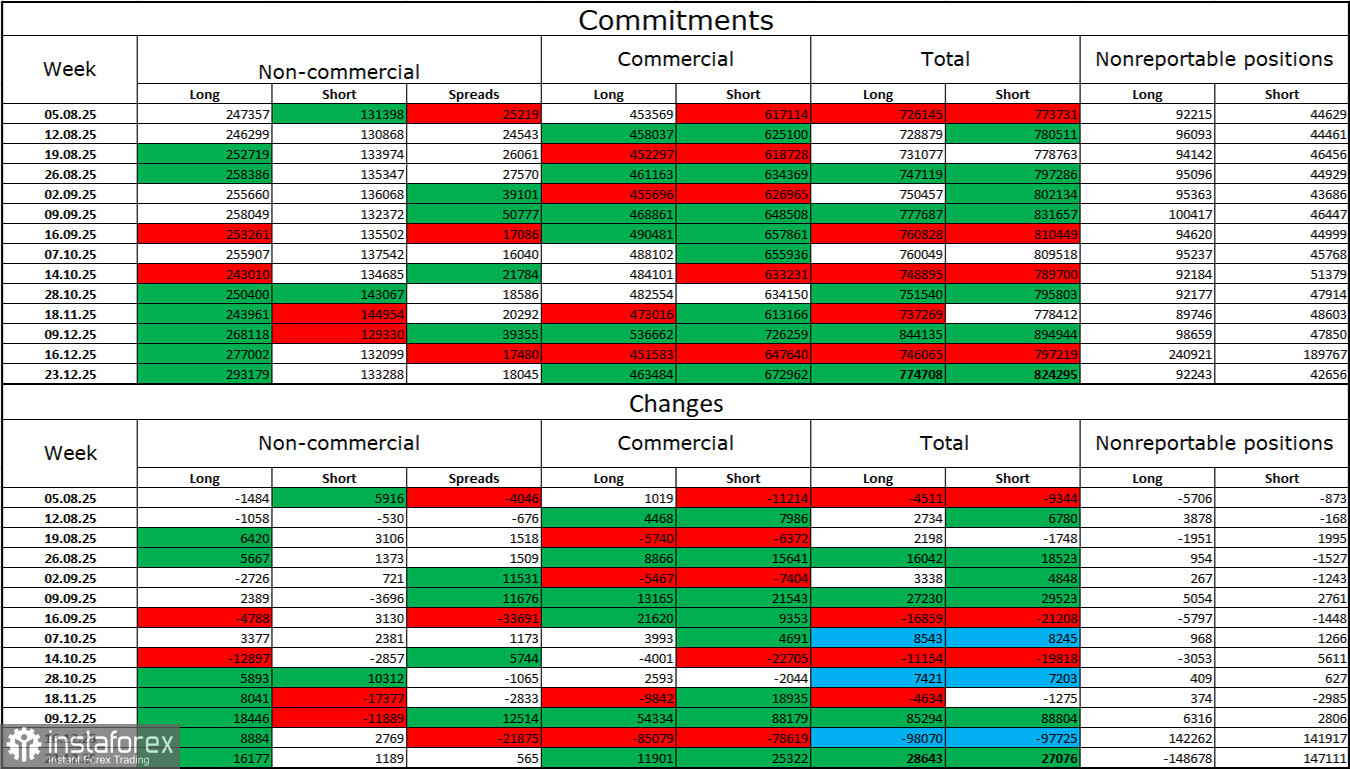
During the latest reporting week, professional traders opened 16,177 long positions and 1,189 short positions. The sentiment of the Non-commercial group remains bullish thanks to Donald Trump and his policies, and continues to strengthen over time. The total number of long positions held by speculators now stands at 293,000, while short positions amount to 133,000. This represents more than a twofold advantage for the bulls.
For thirty-three consecutive weeks, large players were reducing short positions and increasing longs. Then the shutdown began, and now we are seeing the same picture again: professional traders continue to build long positions. Donald Trump's policies remain the most significant factor for traders, as they generate numerous problems that will have long-term and structural consequences for the U.S. economy—for example, deterioration in the labor market. Traders fear a loss of Federal Reserve independence in 2026 under pressure from Trump, especially amid the planned resignation of Jerome Powell in May.
U.S. and European Union Economic Calendar
On January 9, the economic calendar contains seven events, two of which can be considered extremely important. The impact of the news background on market sentiment on Friday may be strong in the second half of the day.
EUR/USD Forecast and Trading Advice
Selling opportunities were available after a rebound from the 1.1731 level on the hourly chart, with targets at 1.1686 and 1.1645–1.1648. These targets have been reached. Today, sellers may remain in the market with targets at 1.1607–1.1612 and 1.1566 if the bears push through the 1.1645–1.1648 level. Buying opportunities will emerge after a rebound from one of the two nearest target zones on the hourly chart, with targets at 1.1686 and 1.1731.
Fibonacci grids are drawn from 1.1492–1.1805 on the hourly chart and from 1.1066–1.1829 on the 4-hour chart.
Le recensioni analitiche di InstaForex ti renderanno pienamente consapevole delle tendenze del mercato! Essendo un cliente InstaForex, ti viene fornito un gran numero di servizi gratuiti per il trading efficiente.


