 Rimani
Condizioni di trading
Strumenti


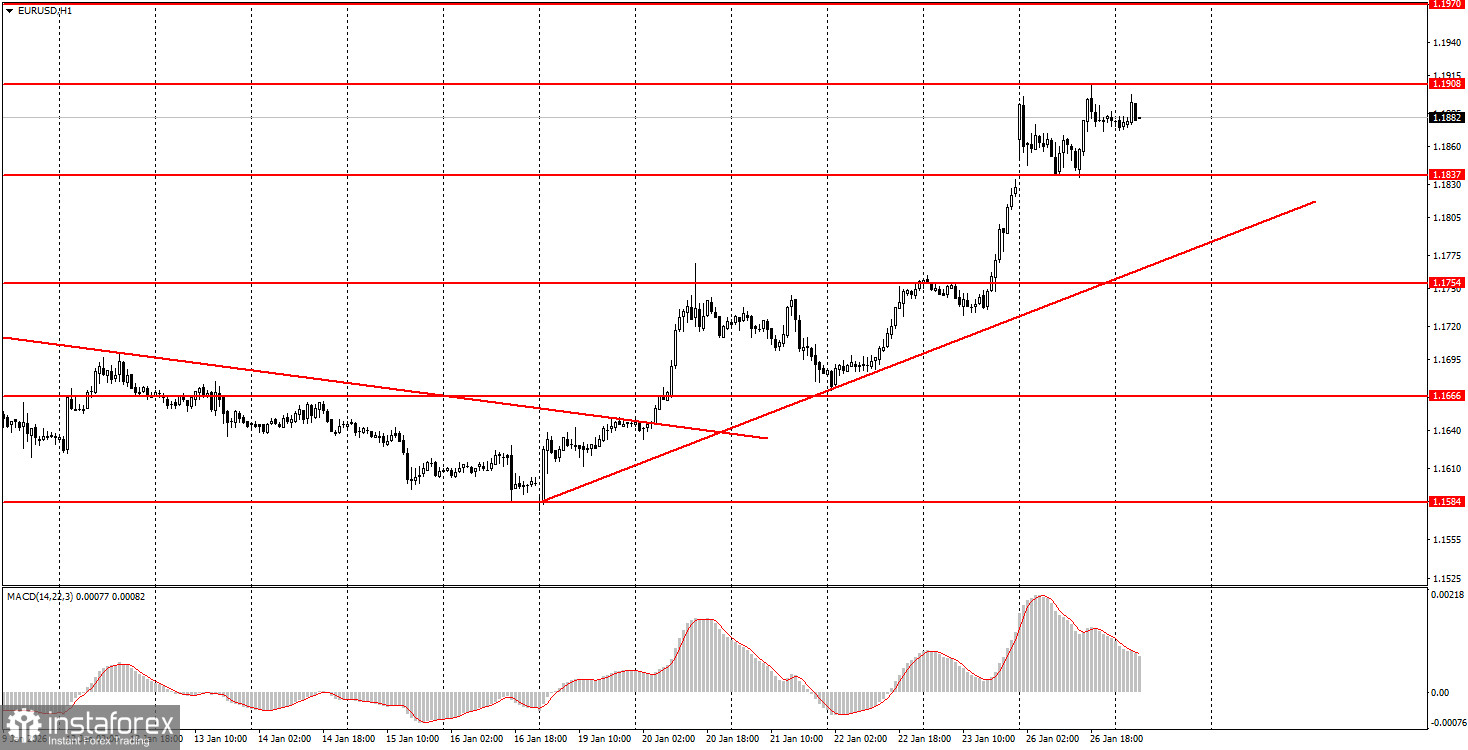
The EUR/USD currency pair attempted to continue its upward movement on Monday but was unable to hold above the level of 1.1908. However, this is not a significant issue. We are almost certain that the growth of the European currency will continue. Yesterday, the price broke out of the sideways channel of 1.1400-1.1830, where it had spent 7 months. Donald Trump continues to do everything possible to drive the market away from the US dollar in the new year. In our view, the dollar's fate is already predetermined. The market even ignored a relatively strong report on US durable goods orders yesterday. The November data were better than expected, but the market showed no joy. Global fundamental factors remain paramount and will continue to push the pair higher. The hourly timeframe continues to show an upward trend, now supported by the trendline. There are no technical or fundamental factors currently suggesting a decline in the euro.
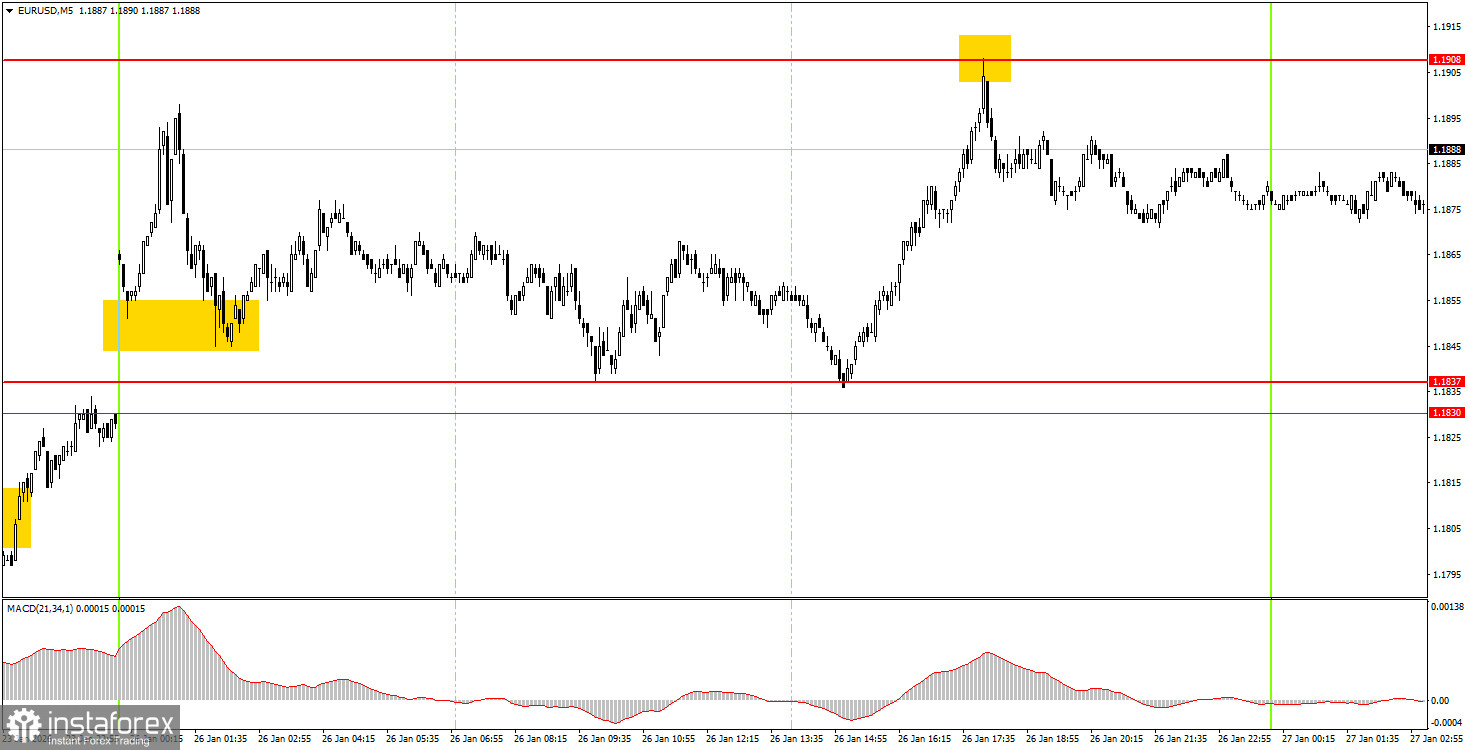
On the 5-minute timeframe, several trading signals were generated on Monday, but we have adjusted some levels, so we only noted the signal that was formed at the old levels. During the American trading session, the pair bounced off the 1.1908 level, which was a sell signal. After that, the pair dropped at least 15 pips, and today it may drop further.
The hourly timeframe continues to form an upward trend. On Monday night, the price settled above the 1.1800-1.1830 range and the broader 1.1400-1.1830 range, indicating that the flat, which lasted for 7 months, may be over. The overall fundamental and macroeconomic backdrop remains very weak for the US dollar, which fully supports the further growth of the European currency.
On Tuesday, beginner traders can open new long positions on a rebound from the area of 1.1830-1.1837 or on a breakout above 1.1908. The price's bounce from the 1.1908 level allowed for short positions targeting 1.1830-1.1837 even yesterday.
On the 5-minute timeframe, the following levels should be considered: 1.1354-1.1363, 1.1413, 1.1455-1.1474, 1.1527-1.1531, 1.1550, 1.1584-1.1591, 1.1655-1.1666, 1.1745-1.1754, 1.1830-1.1837, 1.1908, 1.1970-1.1988. Today, a weekly ADP report on private sector employment will be released in the US, and ECB President Christine Lagarde will speak in the Eurozone. We consider both events to be secondary in the current circumstances.
Support and resistance price levels — levels that serve as targets when opening buys or sells. Take Profit can be placed near them.
Red lines — channels or trendlines that reflect the current tendency and show which direction is preferable to trade now.
MACD indicator (14,22,3) — histogram and signal line — an auxiliary indicator that can also be used as a source of signals.
Important speeches and reports (always listed in the news calendar) can strongly affect a currency pair's movement. Therefore, during their release, trading should be done with maximum caution, or positions should be closed, to avoid a sharp price reversal against the preceding move.
Beginner forex traders should remember that not every trade can be profitable. Developing a clear strategy and effective money management are the keys to long-term trading success.
Le recensioni analitiche di InstaForex ti renderanno pienamente consapevole delle tendenze del mercato! Essendo un cliente InstaForex, ti viene fornito un gran numero di servizi gratuiti per il trading efficiente.


