 Rimani
Condizioni di trading
Strumenti


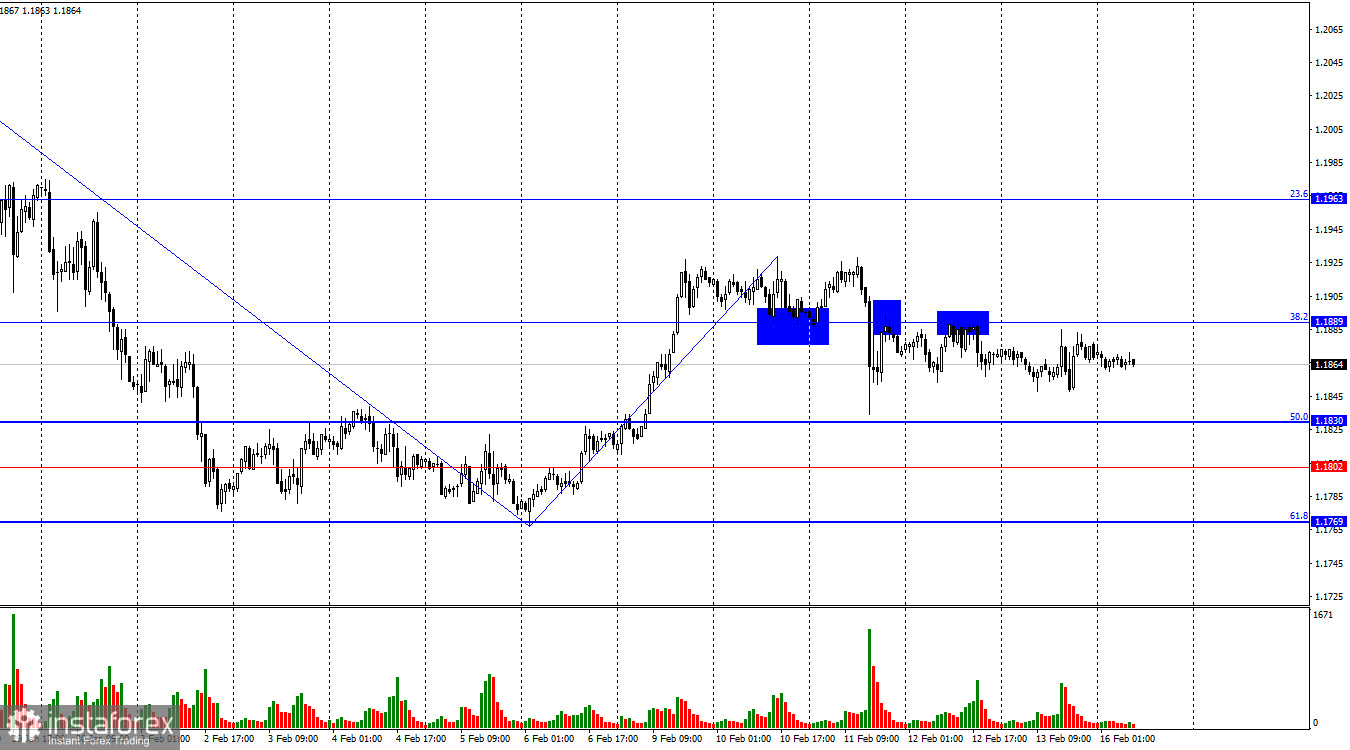
Throughout Friday, the EUR/USD pair continued moving sideways between the 50.0% corrective level at 1.1830 and the 38.2% level at 1.1889. Today, consolidation above 1.1889 would favor the euro and allow for some growth toward the 23.6% corrective level at 1.1963. Consolidation below 1.1830 would open the way for a decline toward the 61.8% Fibonacci level at 1.1769.
The wave situation on the hourly chart remains simple. The last completed downward wave did not break the low of the previous wave, and the last upward wave did not break the previous high. Thus, the trend remains bullish. The bulls have paused within a broader advance that would not have been possible without Donald Trump. Trump has significantly escalated tensions globally and within the United States, and markets continue to respond by moving away from the U.S. dollar, which is seen as carrying economic uncertainty.
On Friday, traders ignored the news background. The inflation report will be discussed in the GBP/USD article; here, the focus is on a potential U.S. attack on Iran. For several weeks, Donald Trump has threatened to deliver a decisive strike against Iranian facilities, opposed the current regime and authorities, and supported protesters, among whom about 3,000 deaths have been reported. Yesterday, it became known that Trump ordered a second fleet of military ships to head toward the Persian Gulf. According to Reuters, U.S. forces are preparing for a multi-week operation aimed at overthrowing the current government and destroying military bases and nuclear facilities. Meanwhile, Tehran has refused to stop uranium enrichment and is preparing to repel a potential U.S. attack. At the same time, negotiations between Washington and Tehran continue, but according to sources close to the process, progress remains minimal. It is likely that as long as there is any chance of reaching an agreement, Trump will not order a strike. However, in my view, the probability of a deal being reached is extremely low.
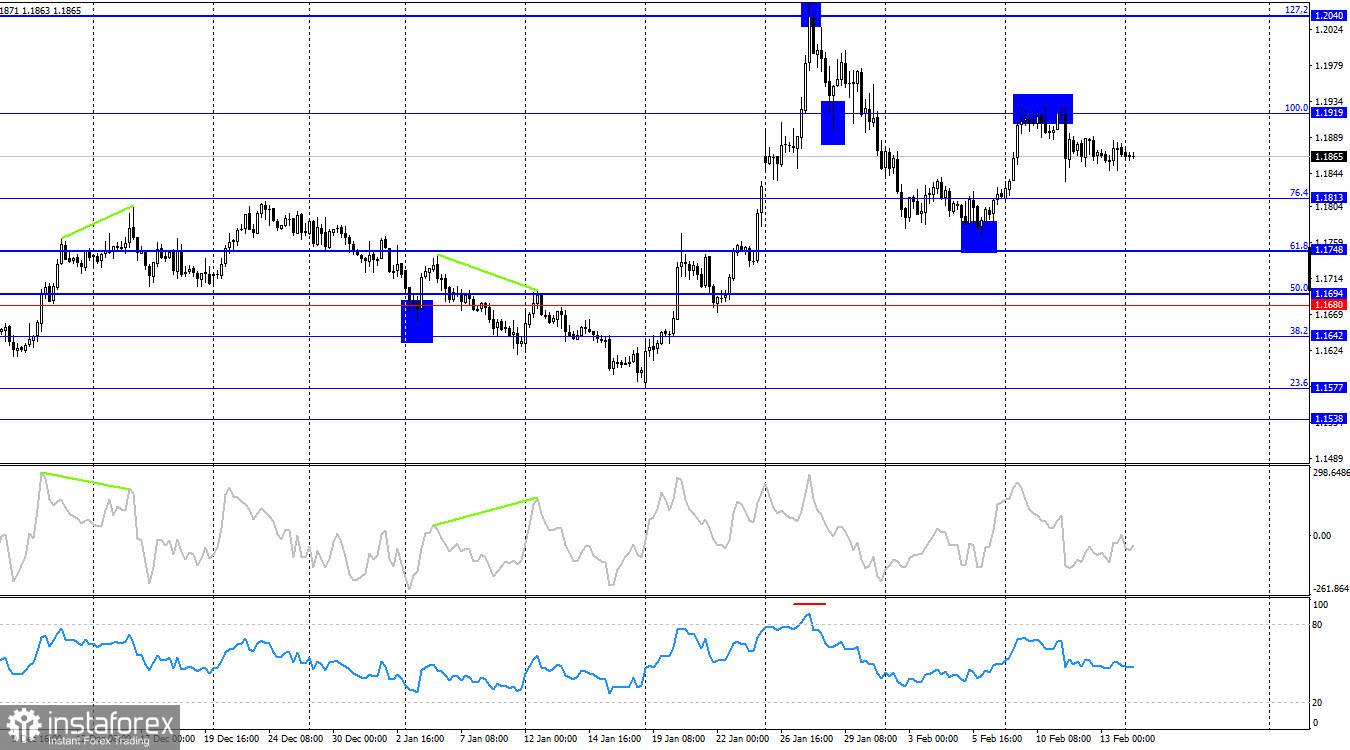
On the 4-hour chart, the pair rebounded from the 100.0% corrective level at 1.1919 based on a new Fibonacci grid and reversed in favor of the U.S. dollar. Therefore, the decline may continue toward the 76.4% Fibonacci level at 1.1813. Consolidation above 1.1919 would increase the likelihood of continued growth toward the resistance level of 1.2040–1.2066. No emerging divergences are currently observed on any indicators.
Commitments of Traders (COT) Report:
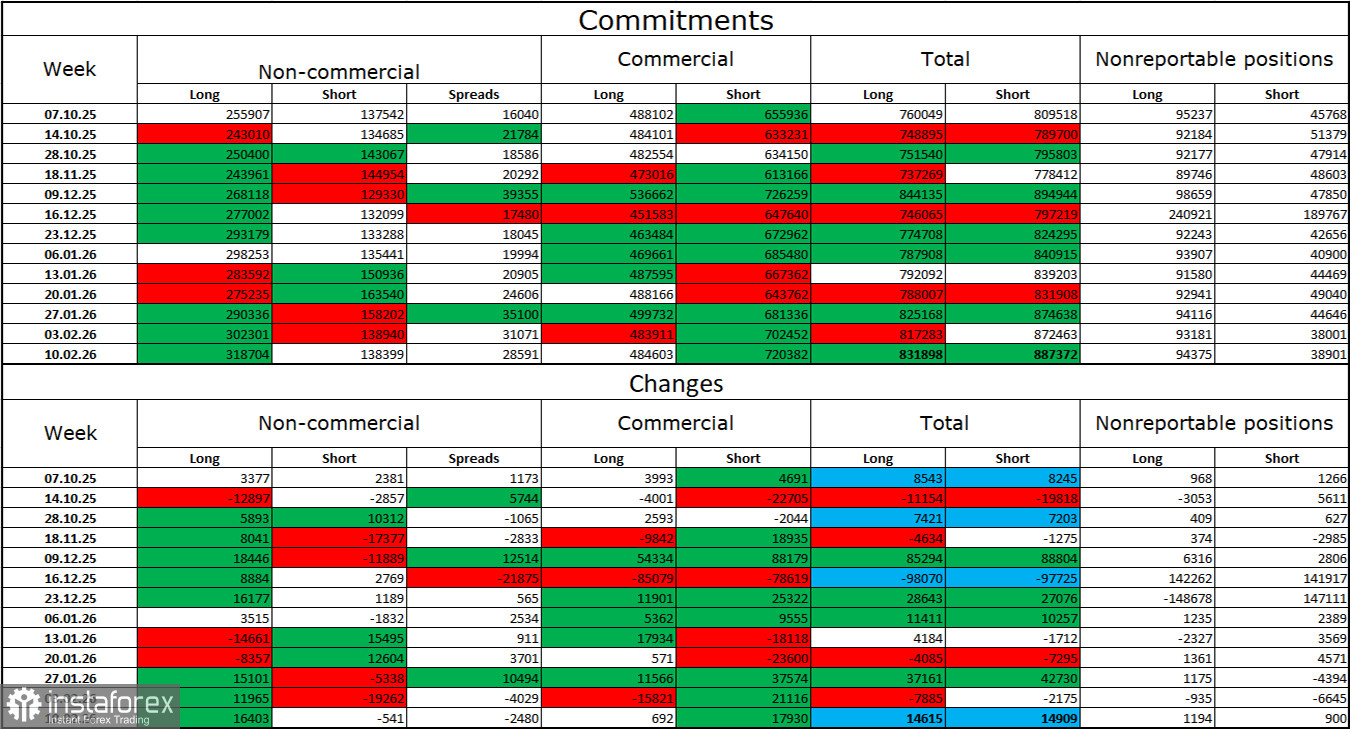
During the latest reporting week, professional traders opened 16,403 long positions and closed 541 short positions. Sentiment among the "Non-commercial" group remains bullish, largely due to Donald Trump and his policies, and continues to strengthen. The total number of long positions held by speculators now stands at 319,000, compared to 138,000 short positions. This represents more than a twofold advantage for the bulls.
For thirty-three consecutive weeks, large traders reduced short positions and increased long positions. Then a shutdown occurred, but now we are observing the same pattern again: professional traders continue increasing their long exposure. Donald Trump's policies remain the most significant factor for traders, as they create numerous long-term structural challenges for the U.S., including a serious deterioration of the labor market (2025), and a decline in global reputation. Traders are also concerned about the potential loss of Federal Reserve independence in 2026 and Trump's geopolitical ambitions.
News Calendar for the U.S. and the European Union:
European Union – Change in Industrial Production (10:00 UTC).
On February 16, the economic calendar contains one entry, and it is not particularly significant. The impact of the news background on market sentiment on Monday may be very limited.
EUR/USD Forecast and Trading Tips:
Selling opportunities were possible upon an hourly close below 1.1889 with a target of 1.1830. These positions can still be held today. Buying opportunities will arise upon an hourly close above 1.1889 with a target of 1.1963.
Fibonacci grids are drawn from 1.1805–1.1578 on the hourly chart and from 1.1919–1.1471 on the 4-hour chart.
Le recensioni analitiche di InstaForex ti renderanno pienamente consapevole delle tendenze del mercato! Essendo un cliente InstaForex, ti viene fornito un gran numero di servizi gratuiti per il trading efficiente.


