 Rimani
Condizioni di trading
Strumenti


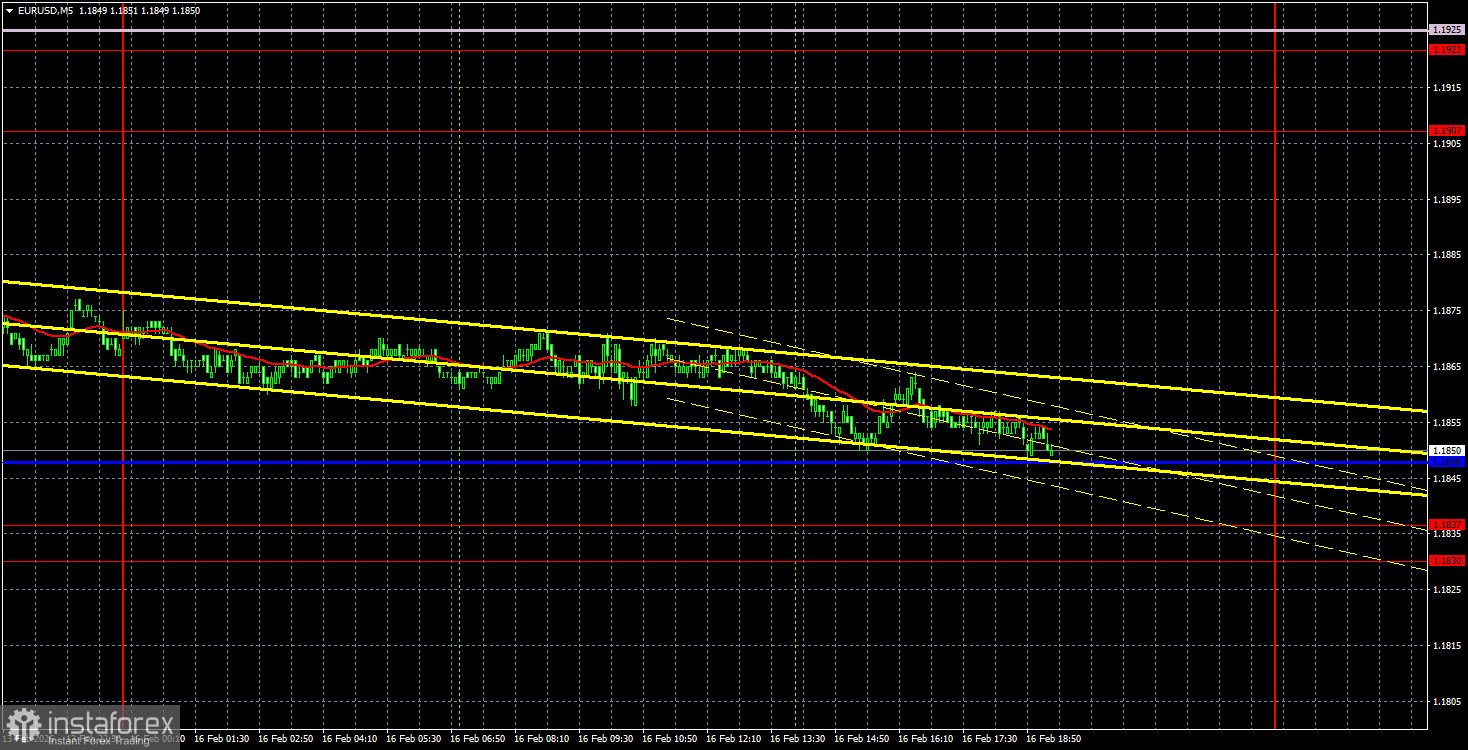
The EUR/USD currency pair traded with approximately 30 pips of volatility on Monday... Overall, after such price fluctuations, there is simply nothing to analyze. It is evident that the technical picture, even on the hourly timeframe, has not changed. The price continues to sit slightly above the critical line but is unable to either overcome it or bounce off it. Thus, the trading strategy remains the same – trades from the critical line and the 1.1830-1.1837 area. However, it is now important to keep in mind the super-low volatility.
From macroeconomic and fundamental events on Monday, the only notable release is the Eurozone industrial production report. As expected, production volumes decreased, but this time it was slightly weaker than experts had anticipated. In any case, there was no reaction to the sole report of the day, as we warned.
On the 5-minute timeframe, despite the proximity of the Kijun-sen line, no trading signals were formed during the day. A bounce off the critical line would allow for long positions, but it should be remembered that one cannot expect strong movements and high profits from the trade at this time.
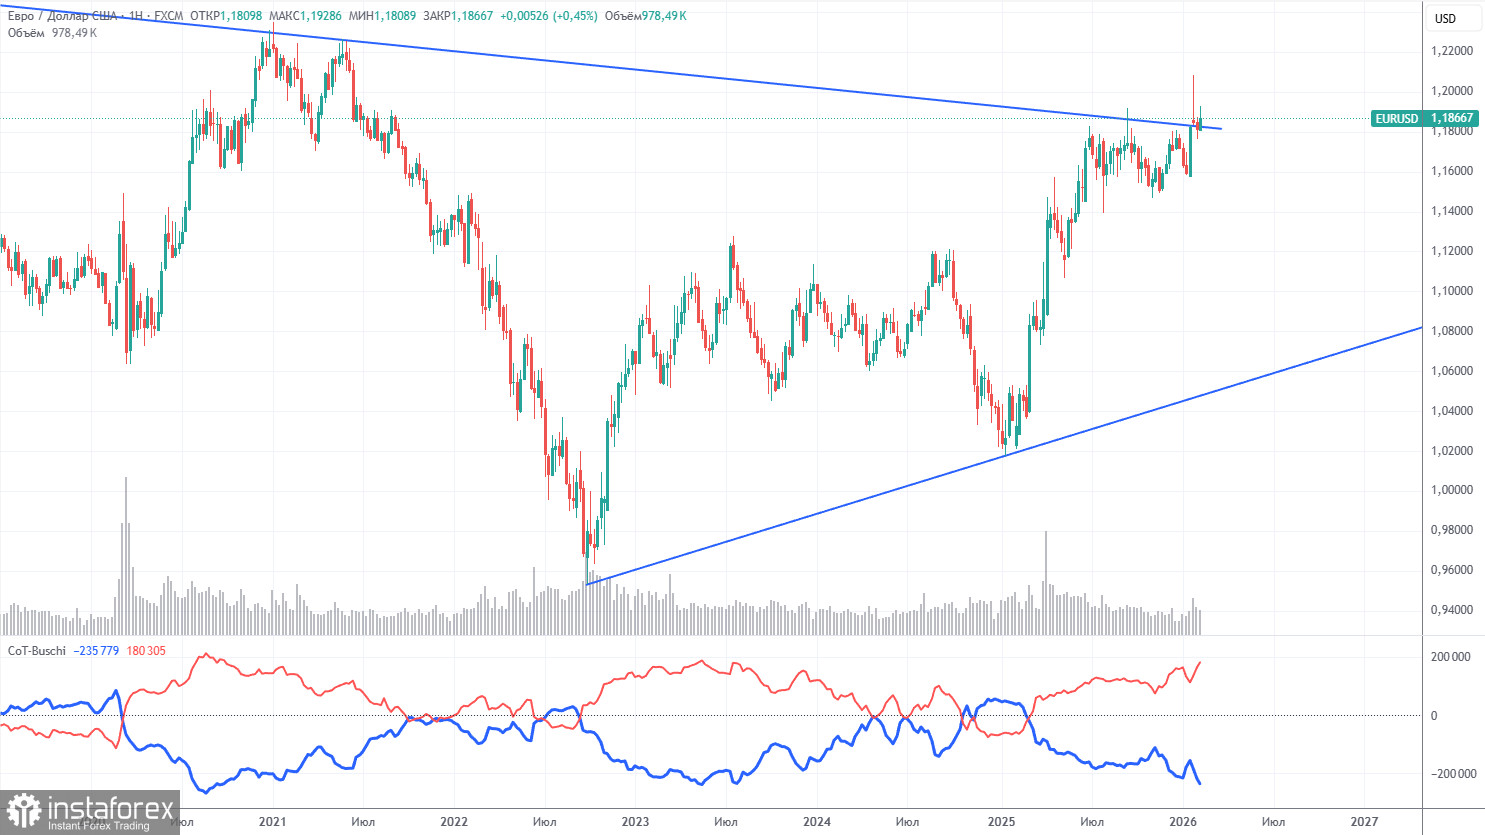
The last COT report is dated February 10. The illustration on the weekly timeframe clearly shows that the net position of non-commercial traders remains "bullish." Since Trump took office as President of the United States for the second time, only the dollar has been falling. We cannot say with 100% certainty that the decline of the American currency will continue, but current developments worldwide suggest this is a possibility.
We still do not see any fundamental factors that would strengthen the European currency, while there are still sufficient factors for the decline of the American one. The global downward trend is still in place, but what does it matter now, when the price has moved over the past 18 years? A new upward trend has formed over the last three years, breaking the global downward trend line. Thus, the path further upward is open.
The indicator's red and blue lines continue to indicate the preservation of the bullish trend. Over the last reporting week, the number of longs in the "Non-commercial" group increased by 16,400, while the number of shorts decreased by 500. Accordingly, the net position increased by another 16,900 contracts over the week.
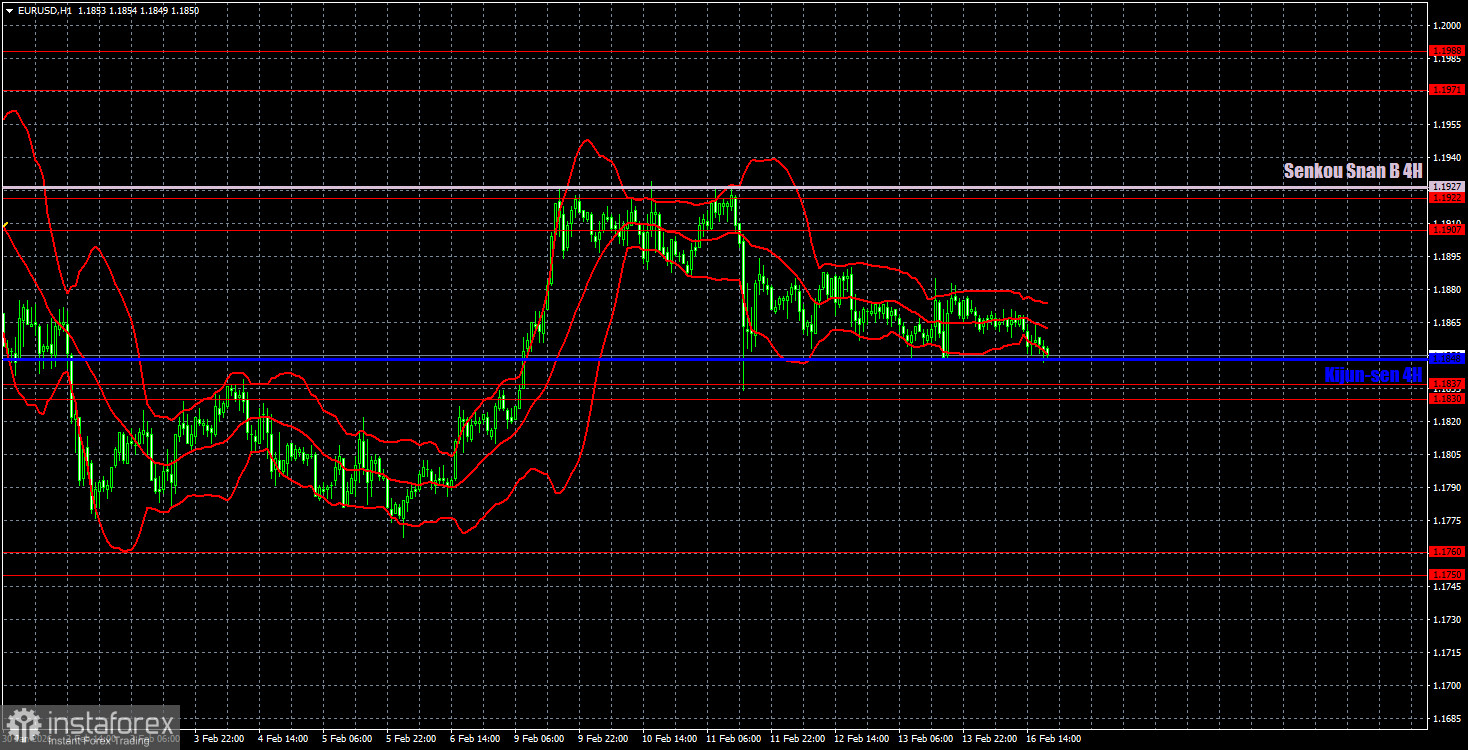
On the hourly timeframe, the EUR/USD pair remains below the Senkou Span B line, which hinders its upward movement. The pair exited the sideways channel of 1.1400-1.1830 at the beginning of the year, where it spent seven months; therefore, the upward trend has officially resumed. To technically restore the upward trend on the hourly timeframe, the price must now consolidate above the Senkou Span B line. In the near future, trades could occur between 1.1830 and 1.1927.
For February 17, we highlight the following trading levels – 1.1362, 1.1426, 1.1542, 1.1604-1.1615, 1.1657-1.1666, 1.1750-1.1760, 1.1830-1.1837, 1.1907-1.1922, 1.1971-1.1988, 1.2051, 1.2095, as well as the Senkou Span B line (1.1927) and Kijun-sen line (1.1848). The Ichimoku indicator lines may move throughout the day, which should be taken into account when determining trading signals. Don't forget to set a stop-loss order to breakeven if the price moves 15 pips in the correct direction. This protects against potential losses if the signal turns out to be false.
On Tuesday, only secondary reports are scheduled in the Eurozone: the second estimate of January inflation in Germany and the economic sentiment indices from the ZEW Institute. In the U.S., there's also a less significant weekly ADP report. Remember, the market ignored many more important American reports last week.
On Tuesday, traders may trade from the area of 1.1830-1.1848. New longs will become relevant if there is a bounce from this area with a target of 1.1907-1.1927. Short positions can be considered if the price consolidates below the 1.1830-1.1848 area with a target of 1.1750-1.1760.
Support and resistance levels – thick red lines around which movement may end. They are not sources of trading signals.
Kijun-sen and Senkou Span B lines – lines from the Ichimoku indicator transferred to the hourly timeframe from the 4-hour timeframe. They are strong lines.
Extreme levels – thin red lines from which the price has previously bounced. They are sources of trading signals.
Yellow lines – trend lines, trend channels, and any other technical patterns.
Indicator 1 on COT charts – the size of the net position of each category of traders.
Le recensioni analitiche di InstaForex ti renderanno pienamente consapevole delle tendenze del mercato! Essendo un cliente InstaForex, ti viene fornito un gran numero di servizi gratuiti per il trading efficiente.


