 Rimani
Condizioni di trading
Strumenti


Bitcoin has collapsed more than 50% since last October and generally shows little appetite to rally. On the 4?hour chart, occasional "bullish" patterns pop up, but price gains are weak and purely corrective. We believe the correction may be lengthy and complicated while the downtrend remains intact. Therefore, we expect Bitcoin's decline to resume toward $57,500 and below.
Meanwhile, analysts underscore that the US–China rivalry is moving to a new arena: the crypto segment. Recently, US Vice President J.D. Vance said America plans to use Bitcoin as a strategic advantage over China. Vance openly stated, "China doesn't like Bitcoin, but we do." From this statement, it's reasonable to assume US legislation will become ever more crypto-friendly, and Washington views the crypto battlefield as an opportunity to strengthen its edge over its adversary.
You're aware that not long ago, Beijing banned all crypto transactions, mining and access to crypto instruments and firms. China believes all financial flows should be under government control and is actively promoting a state digital currency. The US takes the opposite stance: supporting crypto business, legalizing the market and creating safe conditions for large capital to enter the space.
In theory, the more lenient US crypto rules become, the more financial flows will move into Bitcoin. The remaining question is where the upper limit is. If you're not MicroStrategy, you're probably not trying to buy every single Bitcoin in the world. How much Bitcoin do investors actually need? Do they need all 21 million coins?
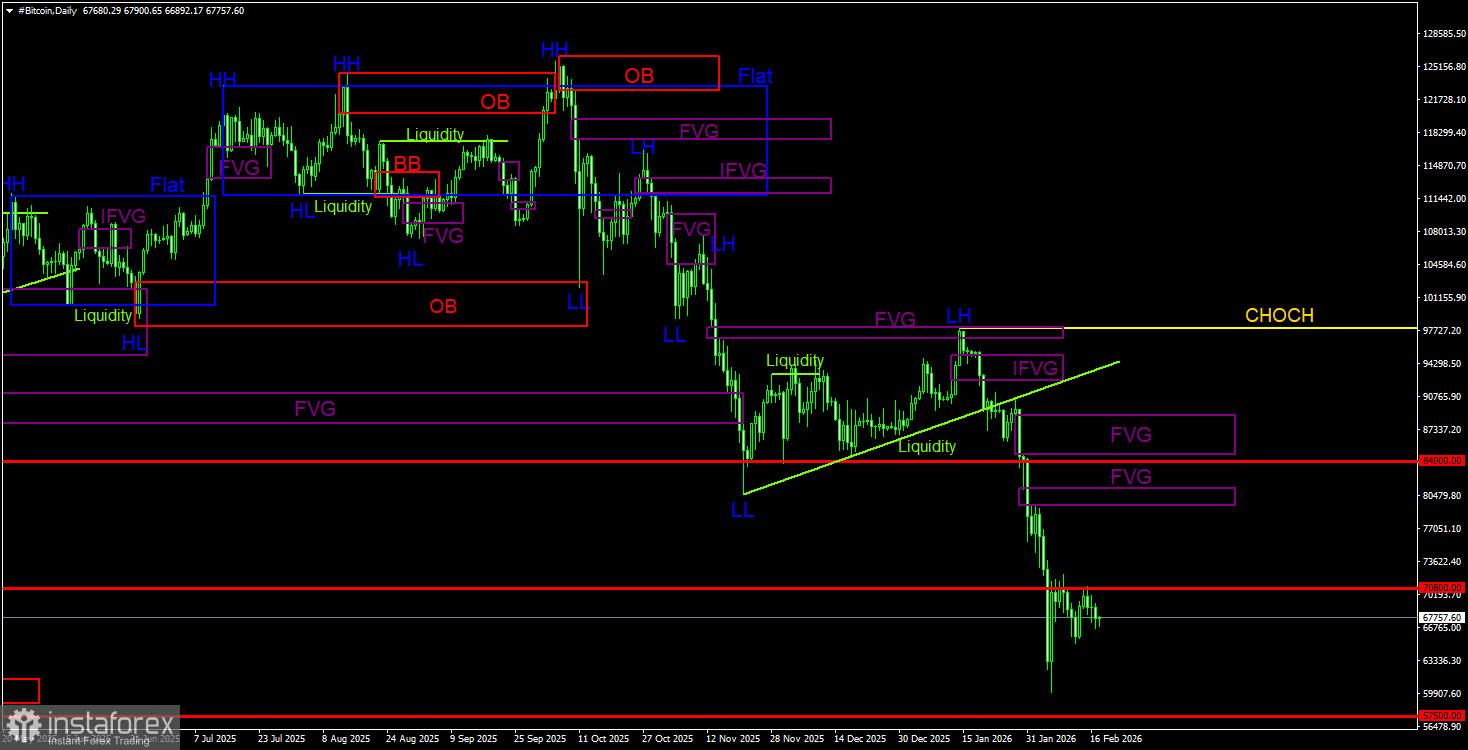
BTC/USD
Bitcoin has been devwloping a full-fledged downtrend. We still expect a drop toward $57,500 (the 61.8% Fibonacci retracement of the three?year uptrend), and there are currently no signs of a trend reversal. Even $57,500 no longer looks like a final stop. On the daily TF, the latest bearish FVG is a POI for shorts but remains far above current prices. The 4?hour TF shows three unresolved bearish FVGs. However, these patterns belong to the prior trend and, by themselves, are unlikely to trigger a trend resumption.
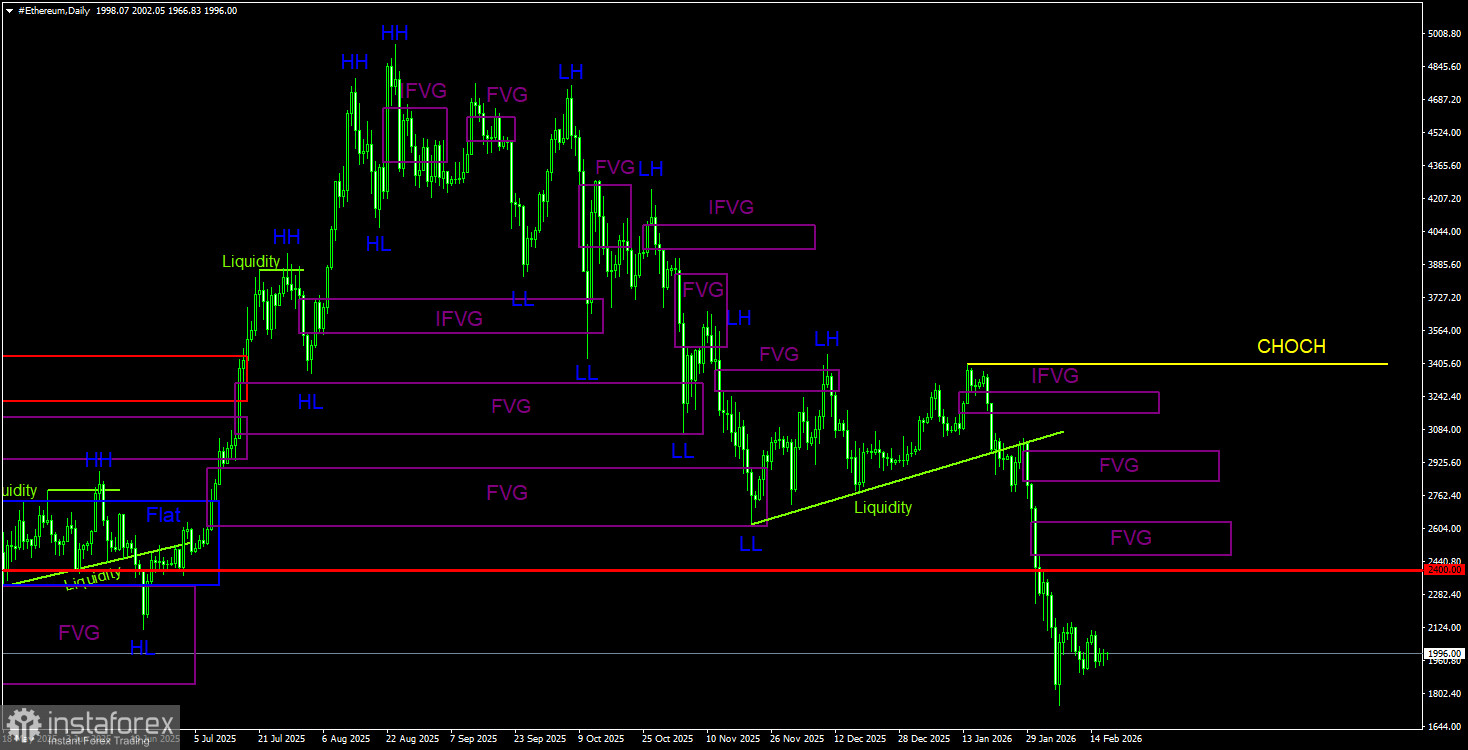
On the daily TF, the downtrend is going on. The key sell pattern remains the bearish order block on the weekly TF. As warned, the move triggered by that signal can be strong and prolonged. Since that pattern formed, Ethereum has already lost about 55% (~$2,500). A near?term corrective bounce is possible. Local upside moves can be traded via bullish patterns on the 4?hour TF, but we would not recommend chasing corrections. In the medium term, we expect daily bearish patterns to play out and the downtrend to resume. Ethereum's downside targets extend down to $1,400.
CHOCH — change of character / break of the trend structure. Liquidity — liquidity, traders' Stop?Losses that market?makers use to build their positions. FVG — Fair Value Gap (area of price inefficiency). Price often moves quickly through such areas, indicating the absence of one particular direction in the market. Later, the price tends to return and react to these zones. IFVG — Inverted Fair Value Gap. After a return to such a zone, the price does not react but impulsively breaks through and then tests it from the other side.
OB — Order Block. A candle on which a market?maker opened a position in order to harvest liquidity and then form their own position in the opposite direction.
Le recensioni analitiche di InstaForex ti renderanno pienamente consapevole delle tendenze del mercato! Essendo un cliente InstaForex, ti viene fornito un gran numero di servizi gratuiti per il trading efficiente.


