 Rimani
Condizioni di trading
Strumenti


The EUR/USD currency pair traded lower again on Wednesday. Throughout the European trading session, the quotes essentially remained in place between the 1.1830 level and the Kijun-sen line (1.1848), but the decline resumed during the American trading session. The European currency faced misfortune again. Despite the global fundamental backdrop not favoring the US dollar, the American currency has found reasons for a slight but consistent rise over the past week and a half. Even yesterday, not-so-important reports on durable goods orders, building permits, and housing starts came in better than forecasted, provoking another strengthening of the dollar. A slight, but yet another strengthening. Even the durable goods orders report supported the bears, as the -1.4% reading came in better than forecasts...
From a technical standpoint, a new downward trend has emerged due to the seven-day decline in quotes. The price is below the Ichimoku indicator lines, but we still regard upward trends with great respect. Thus, from our point of view, in the current situation, it is better to wait for the price to consolidate above the trend line and the Ichimoku indicator lines before trading upwards. Especially since there is a trend, but the price is decreasing on average by 13 pips per day...
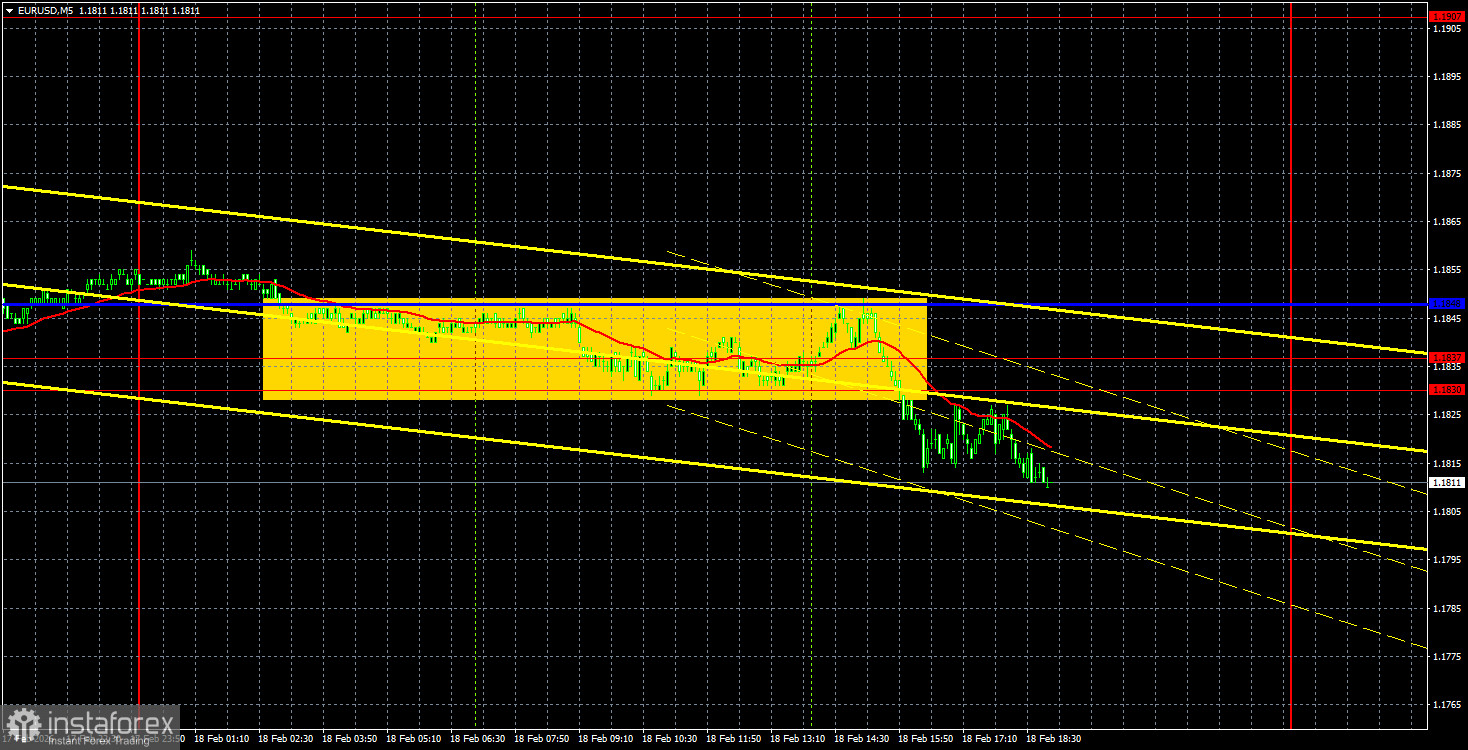
On the 5-minute timeframe, a trading signal was generated yesterday, breaching the 1.1830-1.1848 area. By the end of the day, the price had moved down approximately 15-20 pips. And that is all traders could hope for. The trade could be carried over to Thursday, as with the current volatility, it is unlikely to yield high profits after just a few hours in the market.
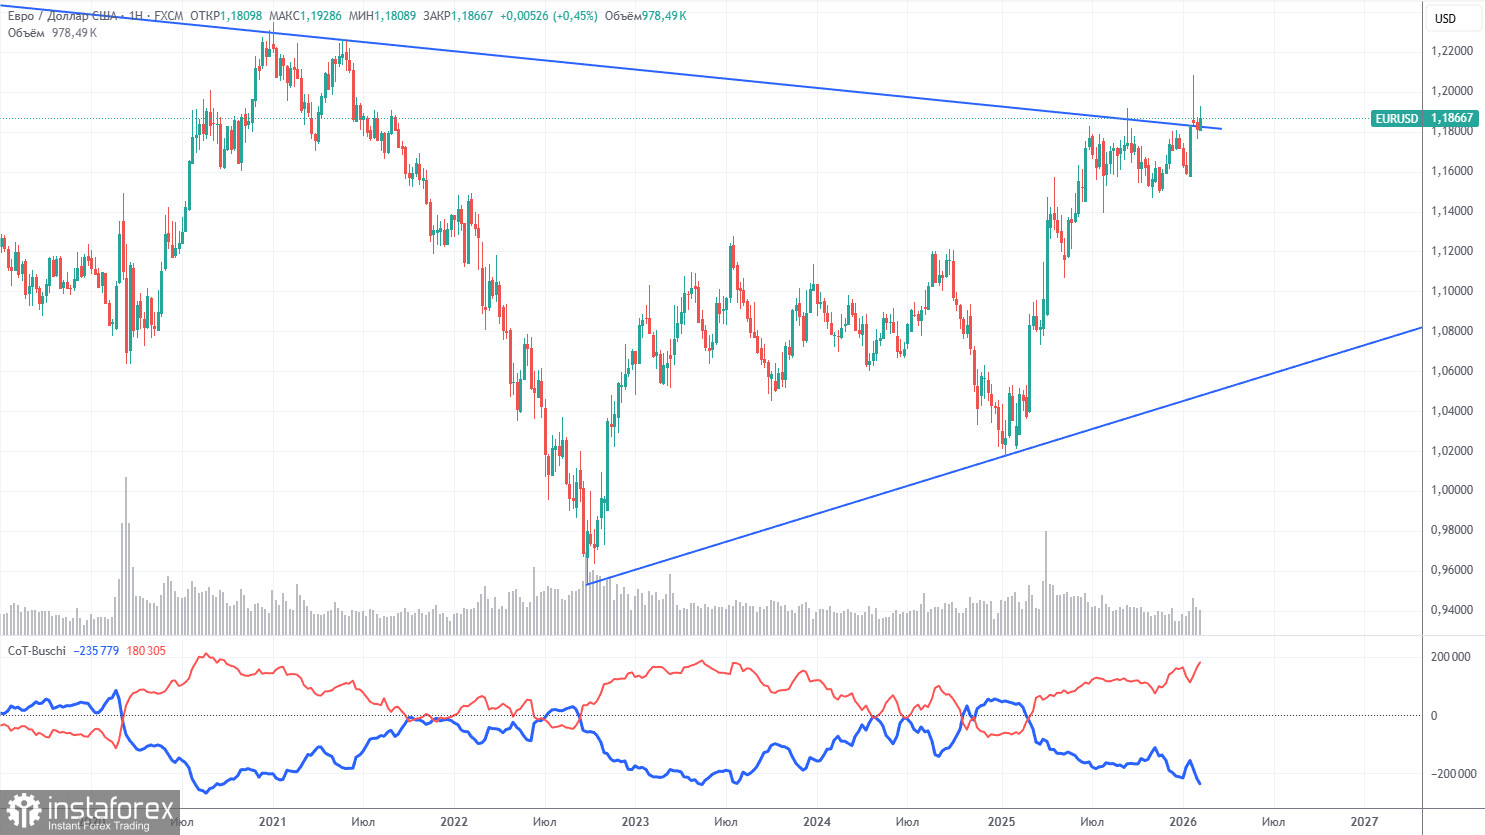
The latest COT report is dated February 10. The illustration on the weekly timeframe clearly shows that the net position of non-commercial traders remains "bullish." Since Trump's second inauguration as President of the United States, only the dollar has been declining. We cannot say with 100% certainty that the decline of the American currency will continue, but current developments around the world suggest this is a possibility.
We still do not see any fundamental factors that would strengthen the European currency, while numerous factors remain that would lead to the American currency's decline. The global downward trend still persists, but what does it matter now, where the price has moved over the past 18 years? A new upward trend has formed over the last three years, breaking the global downward trend line. Thus, the path further North is open.
The position of the red and blue lines of the indicator continues to indicate a "bullish" trend. During the last reporting week, the number of longs for the "non-commercial" group increased by 16,400, while the number of shorts decreased by 500. Consequently, the net position rose by another 16,900 contracts over the week.
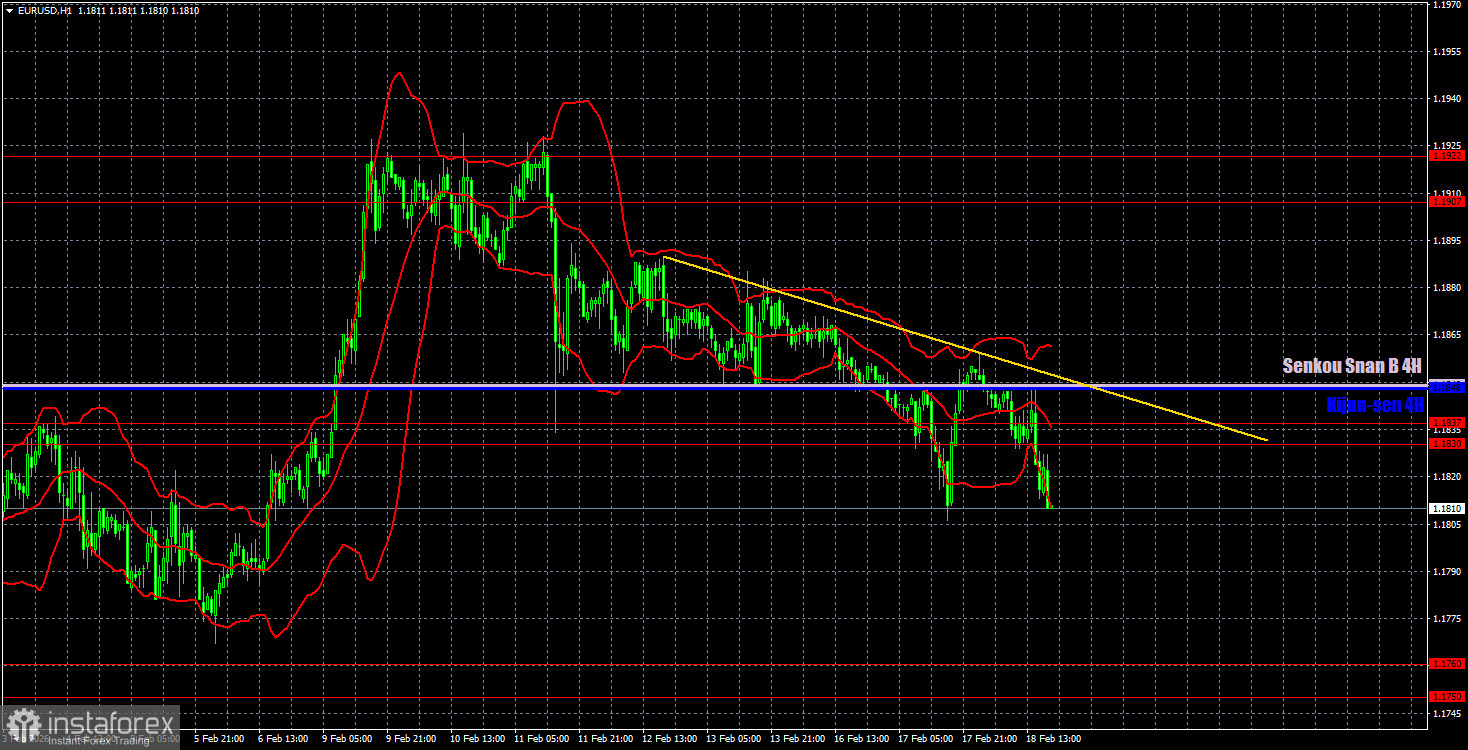
On the hourly timeframe, the EUR/USD pair remains below the Ichimoku indicator's lines, hindering its move upward. The pair left the sideways channel of 1.1400-1.1830 at the beginning of the year, where it spent seven months, thus officially resuming the global upward trend. For a technical recovery of the upward trend on the hourly timeframe, the price must consolidate above the Senkou Span B line and above the trend line.
For February 19, we highlight the following levels for trading—1.1362, 1.1426, 1.1542, 1.1604-1.1615, 1.1657-1.1666, 1.1750-1.1760, 1.1830-1.1837, 1.1907-1.1922, 1.1971-1.1988, 1.2051, 1.2095, as well as the Senkou Span B line (1.1848) and Kijun-sen line (1.1848). The Ikimoku indicator lines may move throughout the day, which should be taken into account when determining trading signals. Don't forget to set the Stop Loss order to break even if the price moves in the right direction by 15 pips. This will protect against potential losses if the signal turns out to be false.
On Thursday, there are no major or even interesting events planned in the Eurozone, while in the United States, the report on unemployment claims will be published, and that's all. Thus, volatility is unlikely to significantly exceed the average values over the past week.
On Thursday, traders can remain in sell positions targeting 1.1750-1.1760, as a sell signal was formed yesterday in the 1.1830-1.1837 range. Long positions can be considered with a target of 1.1907-1.1922 after consolidating above the Ichimoku indicator lines and the trend line.
Support and resistance price levels – thick red lines, where movement may end. They are not sources of trading signals.
The Kijun-sen and Senkou Span B lines – lines of the Ichimoku indicator, transferred to the hourly timeframe from the 4-hour timeframe. They are strong lines.
Extreme levels – thin red lines, which the price previously bounced off. They are sources of trading signals.
Yellow lines – trend lines, trend channels, and any other technical patterns.
Indicator 1 on the COT charts – the size of the net position of each category of traders.
Le recensioni analitiche di InstaForex ti renderanno pienamente consapevole delle tendenze del mercato! Essendo un cliente InstaForex, ti viene fornito un gran numero di servizi gratuiti per il trading efficiente.


