 Rimani
Condizioni di trading
Strumenti


During Wednesday, the EUR/USD pair rebounded from the 61.8% retracement level at 1.1770, reversed in favor of the European currency, and rose toward the 50.0% Fibonacci level at 1.1830. A rebound from the 1.1830 level would favor the U.S. dollar and lead to some decline toward 1.1770. A consolidation above 1.1830 would increase the likelihood of further growth toward the next corrective level of 38.2% at 1.1889 and would most likely signal the end of the bearish trend.
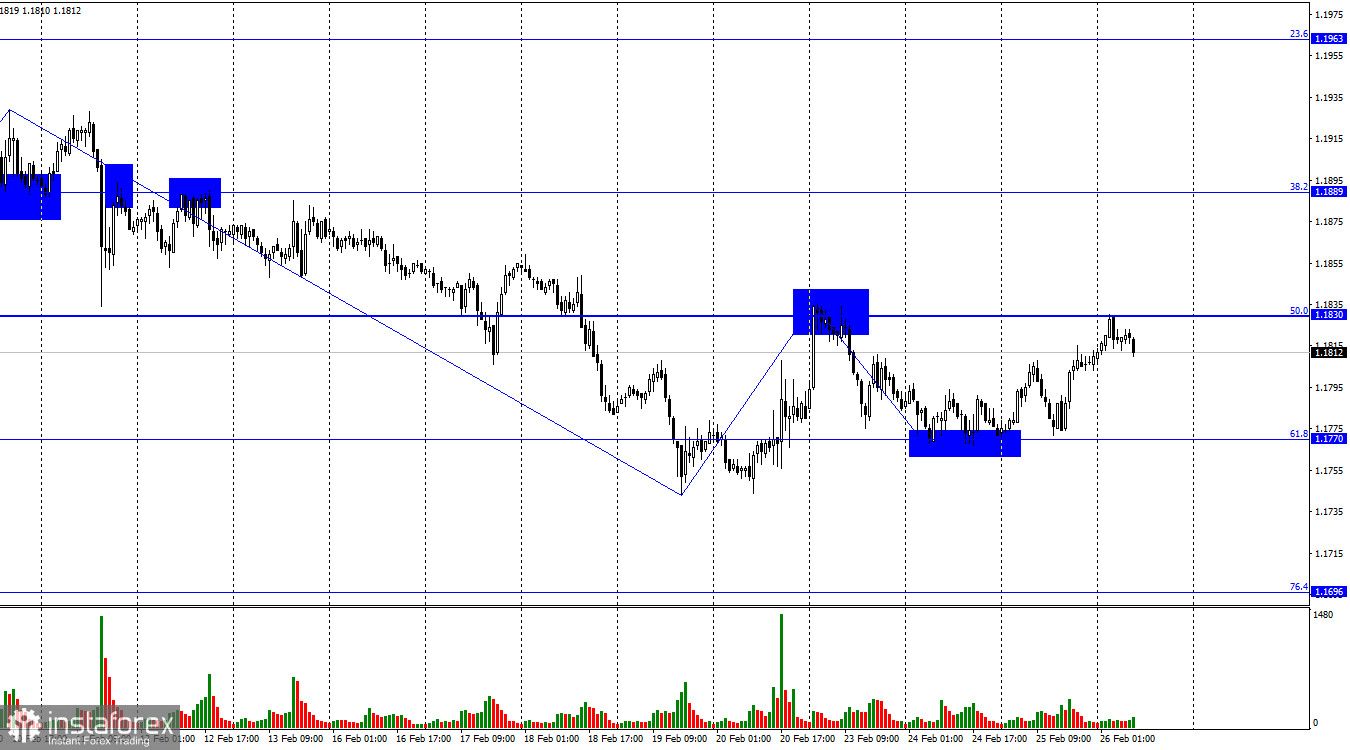
The wave situation on the hourly chart remains simple. The last completed downward wave did not break the previous wave's low, and the new upward wave has not yet broken the previous peak. Thus, the trend remains bearish. The bulls have paused within a large-scale offensive that would have been impossible without Donald Trump, and this pause has dragged on considerably. However, the effective refusal of the U.S. president to comply with the Supreme Court's will could bring the bulls back to the market.
On Wednesday, the news background for both the euro and the dollar was weak, as it has been throughout the current week. The light news flow best explains the sluggish market movements. Yesterday, the bulls regained some optimism amid bear fatigue, but they failed to achieve significant progress. Economic reports from the Eurozone did not support them, so they had to attack on pure enthusiasm. Germany's consumer confidence index came in below traders' expectations. Germany's GDP growth in the fourth quarter remained unchanged from previous estimates at 0.3% quarter-on-quarter and 0.4% year-on-year. The Eurozone consumer price index, as expected, stood at 1.7% year-on-year in January. Let me remind you that the ECB does not consider inflation falling below 2% to be catastrophic and therefore does not plan to ease monetary policy in the near future. This pressure factor is absent for the euro. At the same time, the support factor for the dollar in the form of a potential U.S. attack on Iran is also beginning to fade into the background.
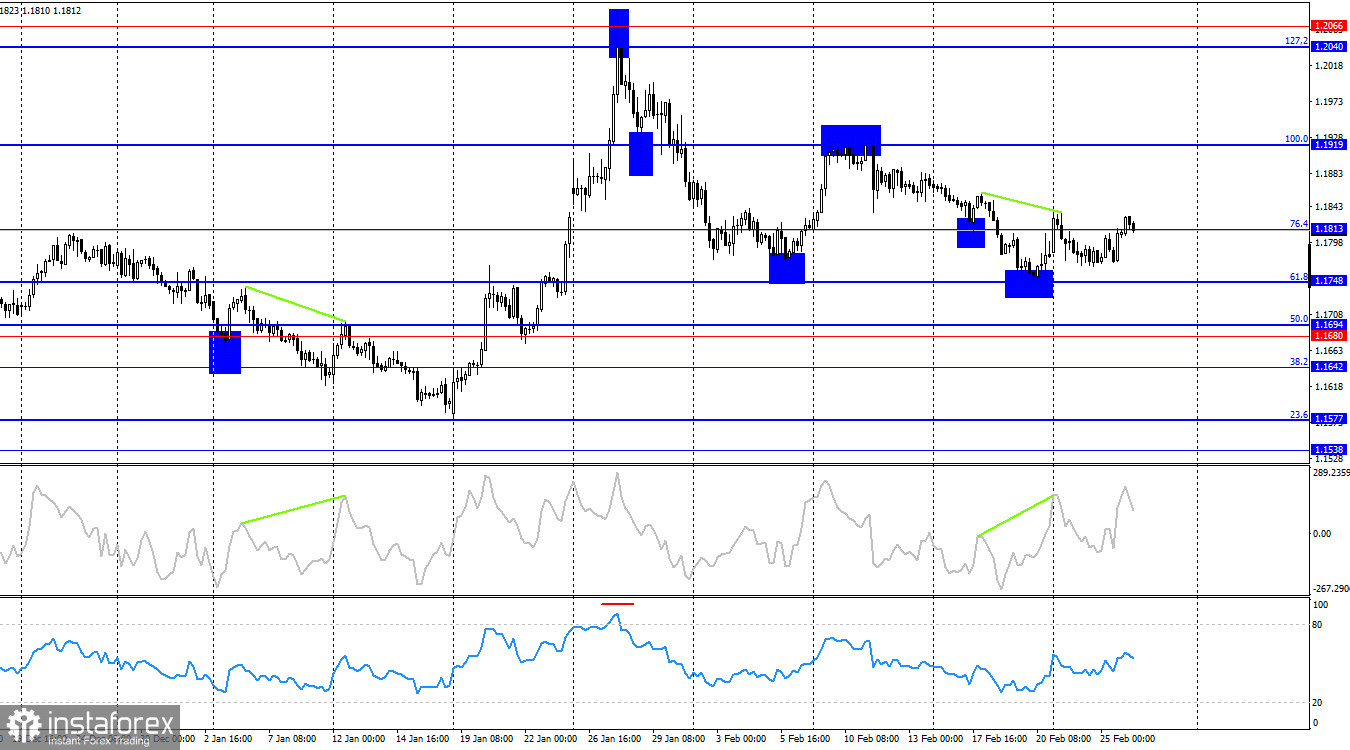
On the 4-hour chart, the pair reversed in favor of the U.S. dollar after a bearish divergence formed on the CCI indicator, but then returned to the 76.4% corrective level at 1.1813. A rebound from this level would push quotes back into a downward channel toward the 61.8% Fibonacci level at 1.1748. A consolidation above 1.1813 would increase the probability of further growth toward the 100.0% corrective level at 1.1919. No new emerging divergences are observed on any indicators.
Commitments of Traders (COT) Report:
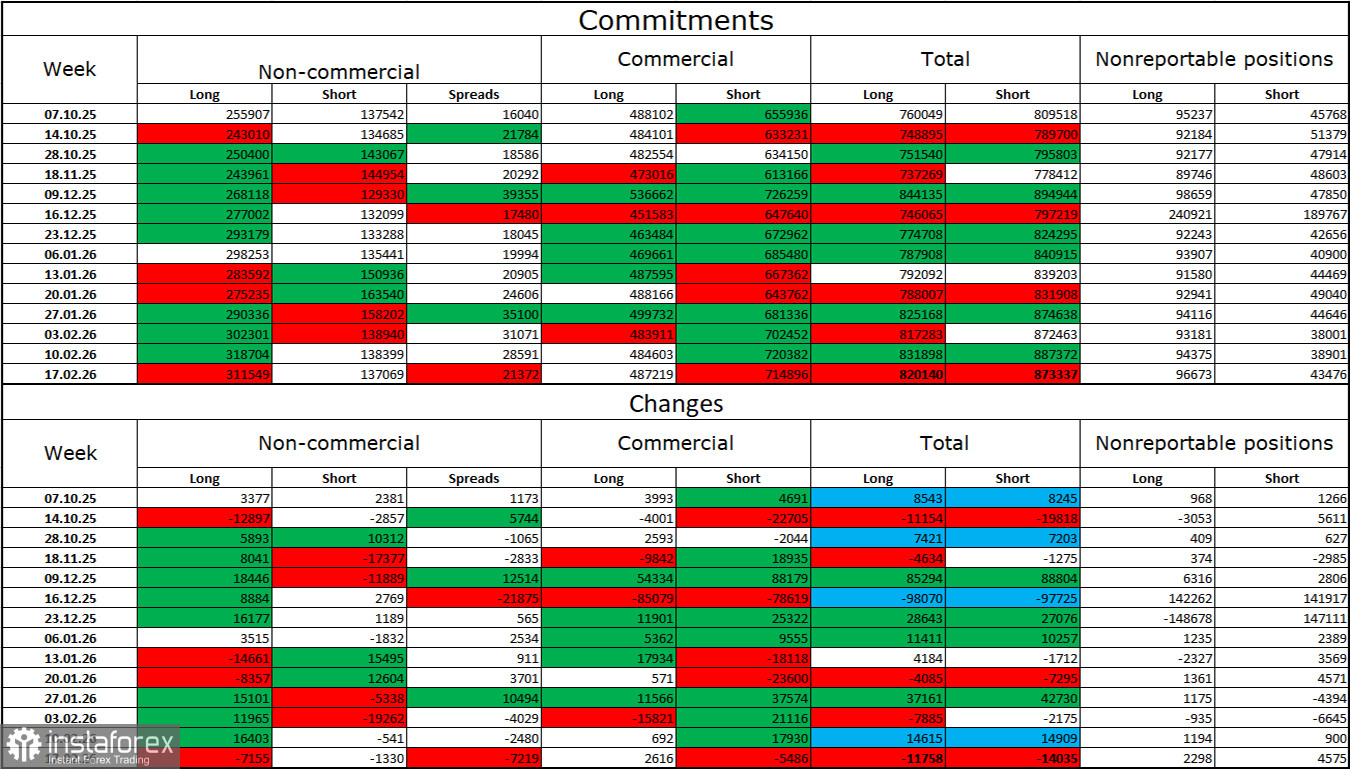
During the latest reporting week, professional traders closed 7,155 long contracts and 1,330 short contracts. The sentiment of the "Non-commercial" group remains bullish thanks to Donald Trump and his policies, and it continues to strengthen over time. The total number of long positions held by speculators now stands at 312,000, compared to 137,000 short positions. This represents more than a twofold advantage for the bulls.
For thirty-three consecutive weeks, large players reduced short positions and increased long positions. Then the shutdown began, and now we observe the same pattern: professional traders continue to build up long positions. Donald Trump's policies remain the most significant factor for traders, as they create numerous problems that will have long-term and structural consequences for the United States. For example, a serious deterioration of the labor market (2025), a decline in global reputation, and capital outflows from the U.S. Traders are also concerned about a potential loss of Federal Reserve independence in 2026 and Donald Trump's geopolitical ambitions.
News Calendar for the U.S. and the Eurozone:
On February 26, the economic calendar contains two minor entries. The impact of the news background on market sentiment on Thursday may be extremely weak or absent.
EUR/USD Forecast and Trading Tips:
Selling the pair is possible today if there is a rebound from the 1.1830 level on the hourly chart with targets at 1.1770 and 1.1696. Buying was possible after a rebound from 1.1770 on the hourly chart with targets at 1.1830 and 1.1889. The first target has been reached.
The Fibonacci retracement grids are built from 1.1805–1.1578 on the hourly chart and from 1.1919–1.1471 on the 4-hour chart.
Le recensioni analitiche di InstaForex ti renderanno pienamente consapevole delle tendenze del mercato! Essendo un cliente InstaForex, ti viene fornito un gran numero di servizi gratuiti per il trading efficiente.


