 Rimani
Condizioni di trading
Strumenti


The GBP/USD currency pair showed an upward movement on Friday. It was a struggle, but the macroeconomic background suggested a decline in the dollar. The market woke up only near the weekend's market close, and the GBP/USD pair rose to the Senkou Span B line. Therefore, if this line is exceeded at the beginning of the new week, the British pound may form a semblance of an upward trend for the first time in a month and a half. If there is a rebound from the Senkou Span B line or the geopolitical conflict in the Middle East escalates further, the pair's decline may resume quickly.
Let us recall that the latest data from overseas do not bode well for either the American economy or the U.S. dollar. Inflation has slowed in recent months, bringing the Fed closer to easing monetary policy. At the same time, the war in Iran has already driven up energy prices worldwide by nearly twofold, so experts anticipate a new rise in inflation. And the Fed may still resume easing policy because, as February data showed, the labor market is not recovering after a strong first year of Trump's presidency, and the U.S. economy slowed to a growth rate of +1.4% in the fourth quarter.
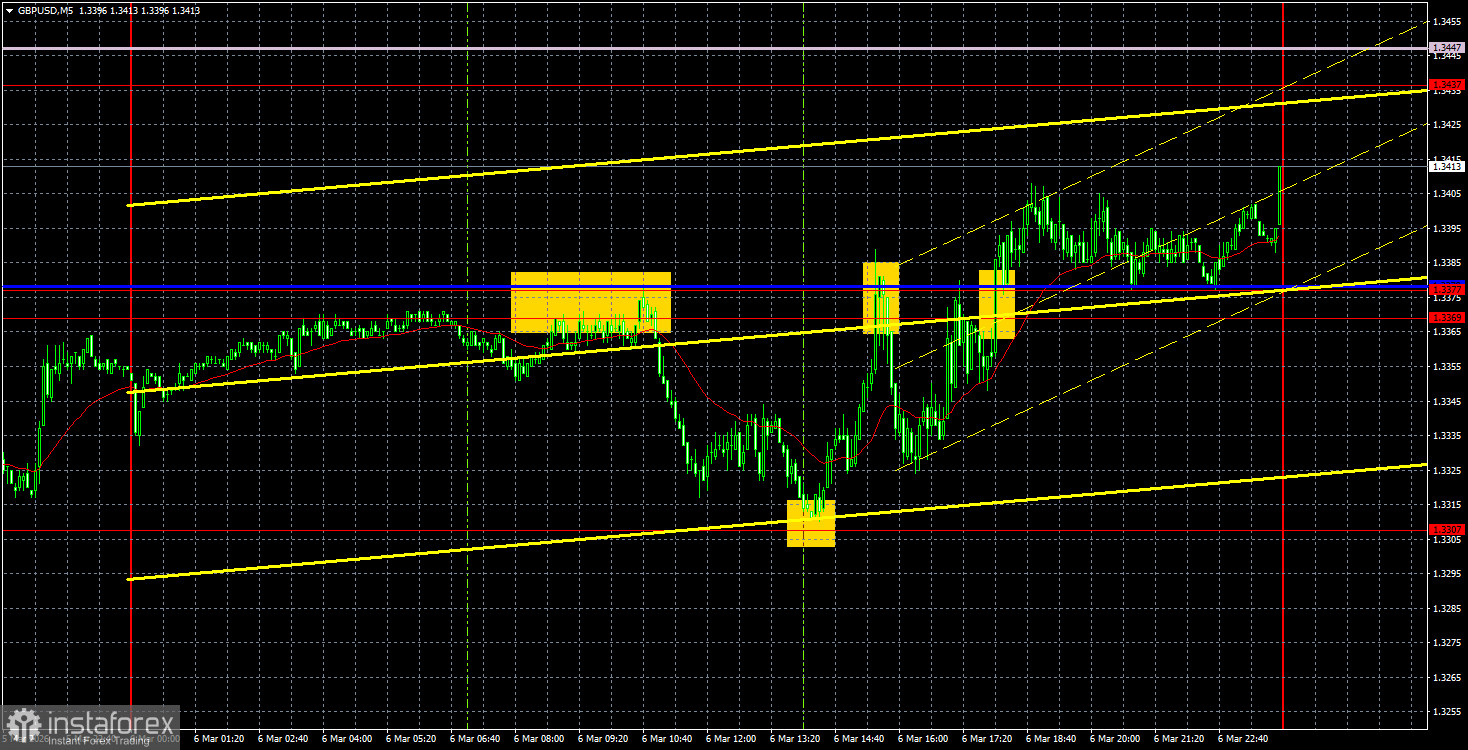
On the 5-minute timeframe on Friday, several rather good trading signals were formed. Initially, the pair bounced between 1.3369 and 1.3377, allowing traders to open short positions. At the beginning of the American session, the level of 1.3307 was reached with a 3-pip margin, allowing sell trades to be closed in profit and long positions to be opened. An hour later, the price returned to the area of 1.3369-1.3377, allowing long trades to be closed also in profit and forming another sell signal. At the end of the week, there was one more buy signal. The last two signals did not generate profits, but neither incurred losses.
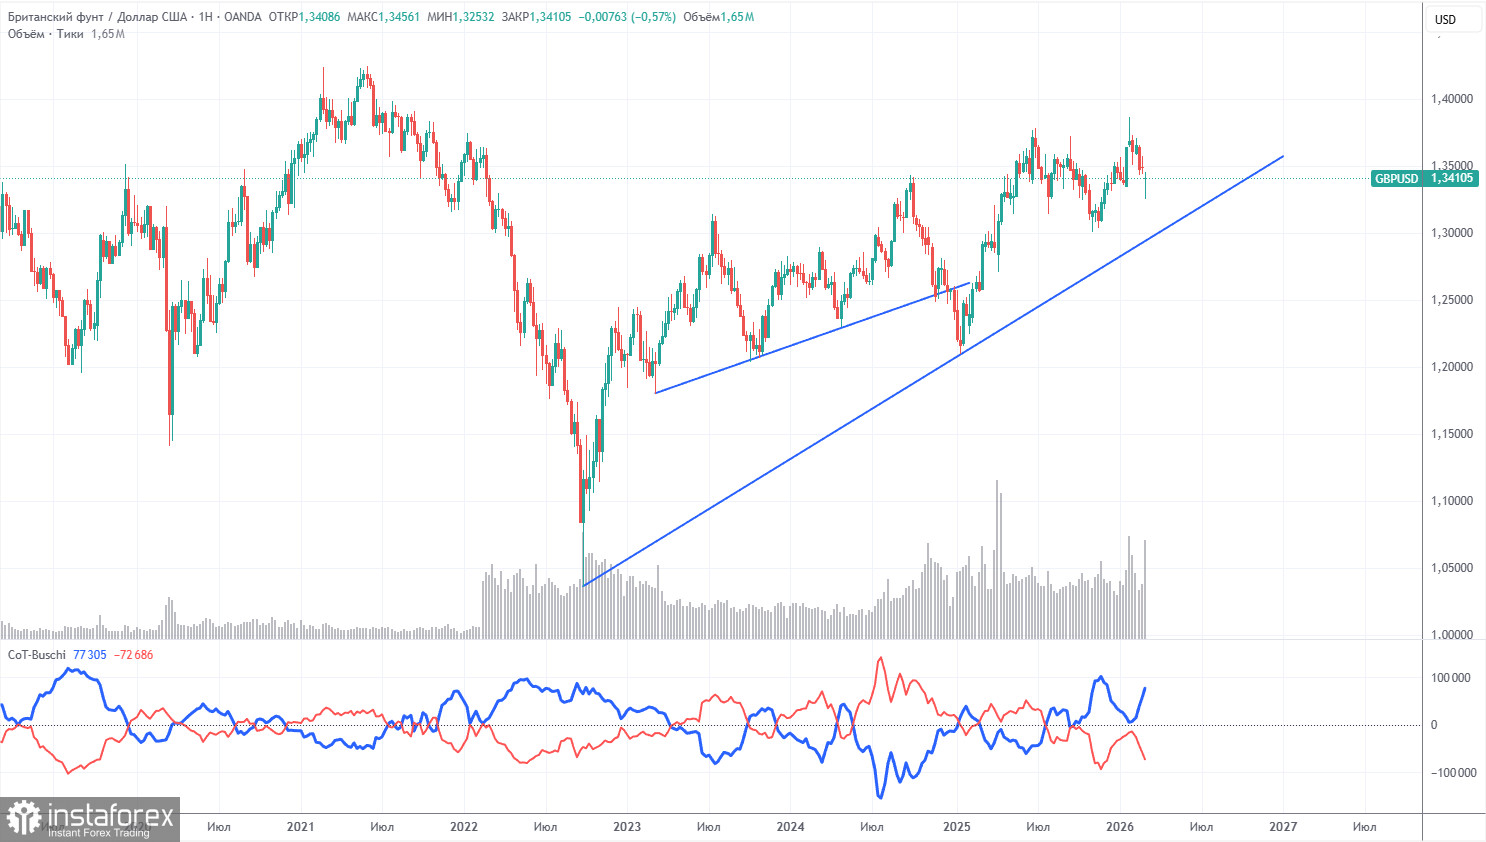
COT reports for the British pound show that, in recent years, the sentiment of commercial traders has been constantly changing. The red and blue lines, reflecting the net positions of commercial and non-commercial traders, frequently cross and are often close to the zero mark. Currently, the lines are diverging, and non-commercial traders remain dominant with... sales. Recently, speculators have actively increased long positions but have not managed to gain a superior zone.
The dollar continues to decline due to Donald Trump's policies, as shown on the weekly timeframe (illustration above). The trade war will continue in one form or another for a long time, and the Fed will be cutting rates in the next 12 months regardless. Demand for the dollar will be falling one way or another. According to the latest COT report (dated March 3) for the British pound, the "Non-commercial" group closed 7,700 BUY contracts and opened 7,900 SELL contracts. Thus, the net position of non-commercial traders decreased by another 15,600 contracts over the week.
In 2025, the pound rose significantly, but the reason was one: Donald Trump's policy. Once this reason is neutralized, the dollar may rise. But when this will happen, no one knows.
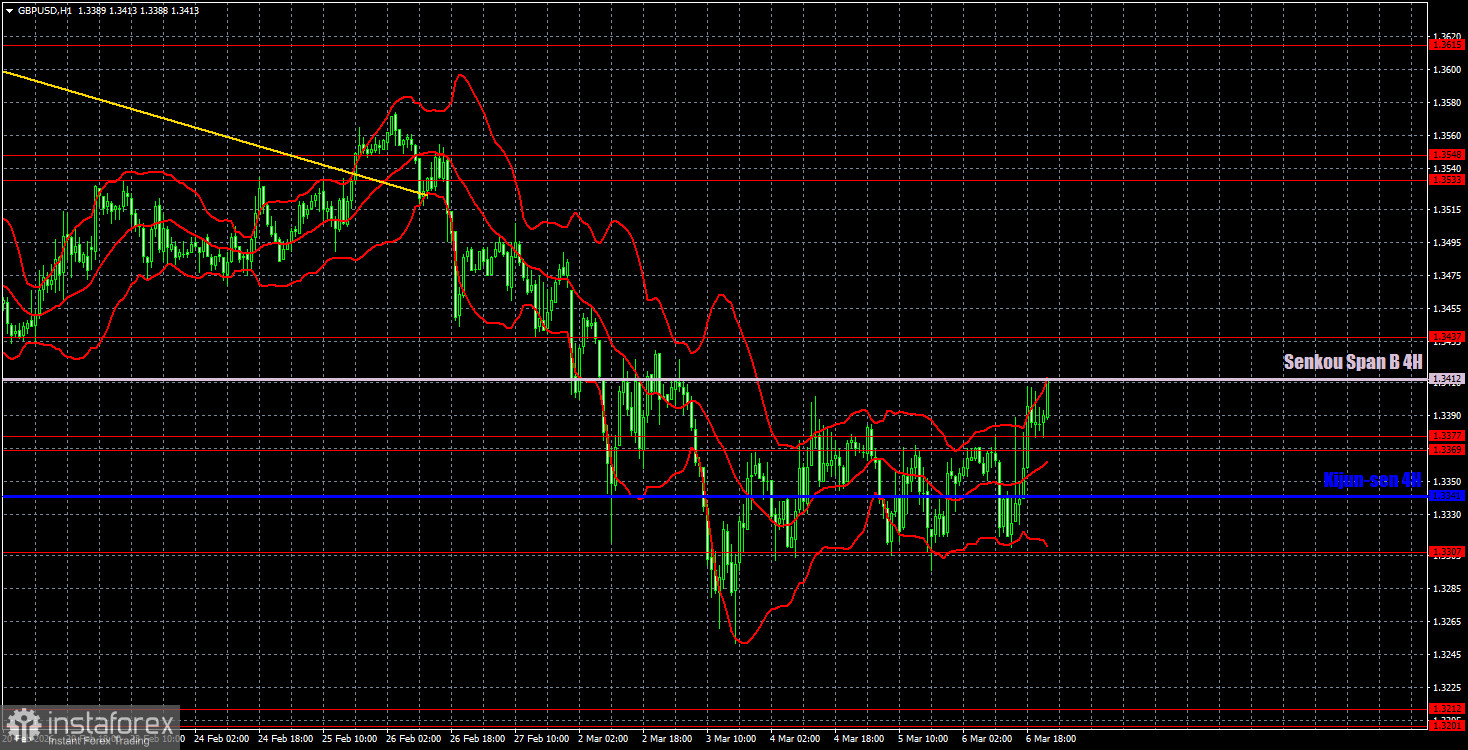
On the hourly timeframe, the GBP/USD pair could have long since entered an upward trend, but geopolitics has pulled the British pound down. Despite the strong decline in the pair from February to March, we still consider it a correction. The daily timeframe is confidently signaling the preservation of the upward trend. Unfortunately, geopolitics is highly unpredictable and can influence market sentiment, as we are currently witnessing.
For March 9, we highlight the following important levels: 1.3096-1.3115, 1.3201-1.3212, 1.3307, 1.3369-1.3377, 1.3437, 1.3533-1.3548, 1.3615, 1.3671-1.3681, 1.3751-1.3763. The Senkou Span B line (1.3412) and the Kijun-sen line (1.3341) may also provide signals. It is recommended to set the Stop Loss to breakeven when the price has moved in the correct direction by 20 pips. The Ichimoku indicator lines may shift throughout the day, which should be taken into account when determining trading signals.
On Monday, there are no significant events scheduled in the UK and the U.S. Thus, geopolitical factors will again take precedence. If there are no significant messages from Iran or related to the Iranian war, the pair may continue to recover. However, the British pound must surpass the Senkou Span B line.
Today, traders may open new short positions with targets at 1.3341 and 1.3307 if the pair rebounds from the Senkou Span B line. Long positions will become relevant with a target in the 1.3533-1.3548 area if the price breaks above the Senkou Span B line.
Price levels of support and resistance – thick red lines where price movement may end. They are not sources of trading signals.
Kijun-sen and Senkou Span B lines – lines of the Ichimoku indicator transferred to the hourly timeframe from the 4-hour timeframe. They are considered strong lines.
Extremum levels – thin red lines from which the price has previously bounced. They are sources of trading signals.
Yellow lines – trend lines, trend channels, and any other technical patterns.
Indicator 1 on COT charts – the size of the net position for each category of traders.
Le recensioni analitiche di InstaForex ti renderanno pienamente consapevole delle tendenze del mercato! Essendo un cliente InstaForex, ti viene fornito un gran numero di servizi gratuiti per il trading efficiente.


