 Rimani
Condizioni di trading
Strumenti


The EUR/USD currency pair showed slight gains on Monday, which were purely technical and corrective. After a strong decline last week, traders paused, and the euro slightly corrected. The only macroeconomic report of the day, on US industrial production, came in slightly stronger than forecasts, so it could not, in theory, provoke a decline in the dollar. Moreover, the market continues to ignore any macroeconomic background. Last week, much more important US reports were disregarded.
In the current circumstances, the absence of a new escalation in the conflict in the Middle East is already good news. However, it cannot be claimed that there is no new escalation. For example, a report came in the morning that Yemen may close the Bab-al-Mandab Strait in support of Iran. During the day, there was news that Israel had launched a ground military operation on Lebanese territory. Therefore, it cannot be said that tensions have completely subsided. However, the dollar cannot rise every day on the same theme. Sooner or later, the market will get used to the new realities, and the dollar will lose its support.
From a technical perspective, the hourly timeframe maintains a downward trend, which raises no questions. To complete it, a price consolidation above the Senkou Span B line is required. We have also formed another descending trend line, but trust in such lines is limited at the moment. Everything depends on geopolitics.
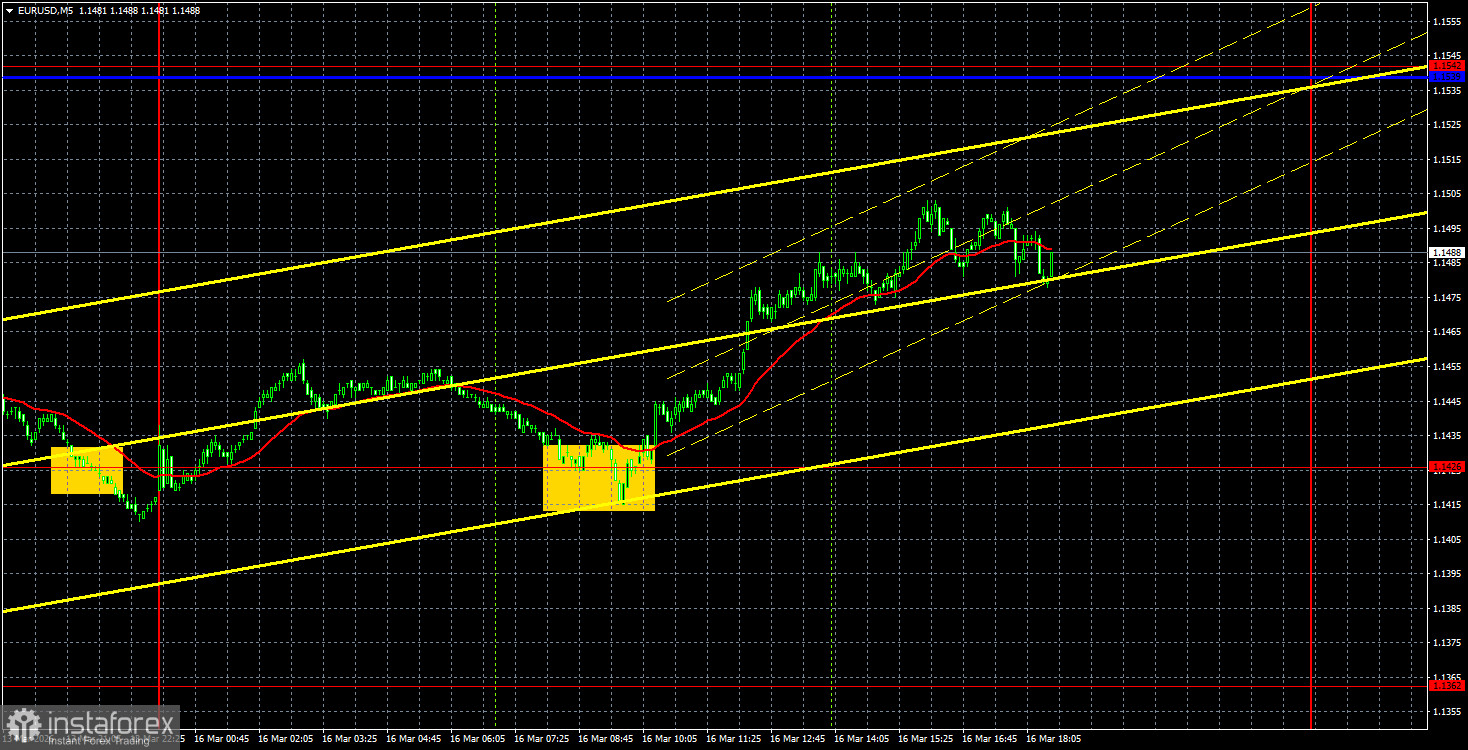
On the 5-minute timeframe, one trading signal was formed over the past day, allowing traders to earn a decent profit. During the European trading session, the price bounced off the 1.1426 level and moved higher until the end of the day. Thus, in the evening, traders could manually close long positions for a profit of about 50 pips.
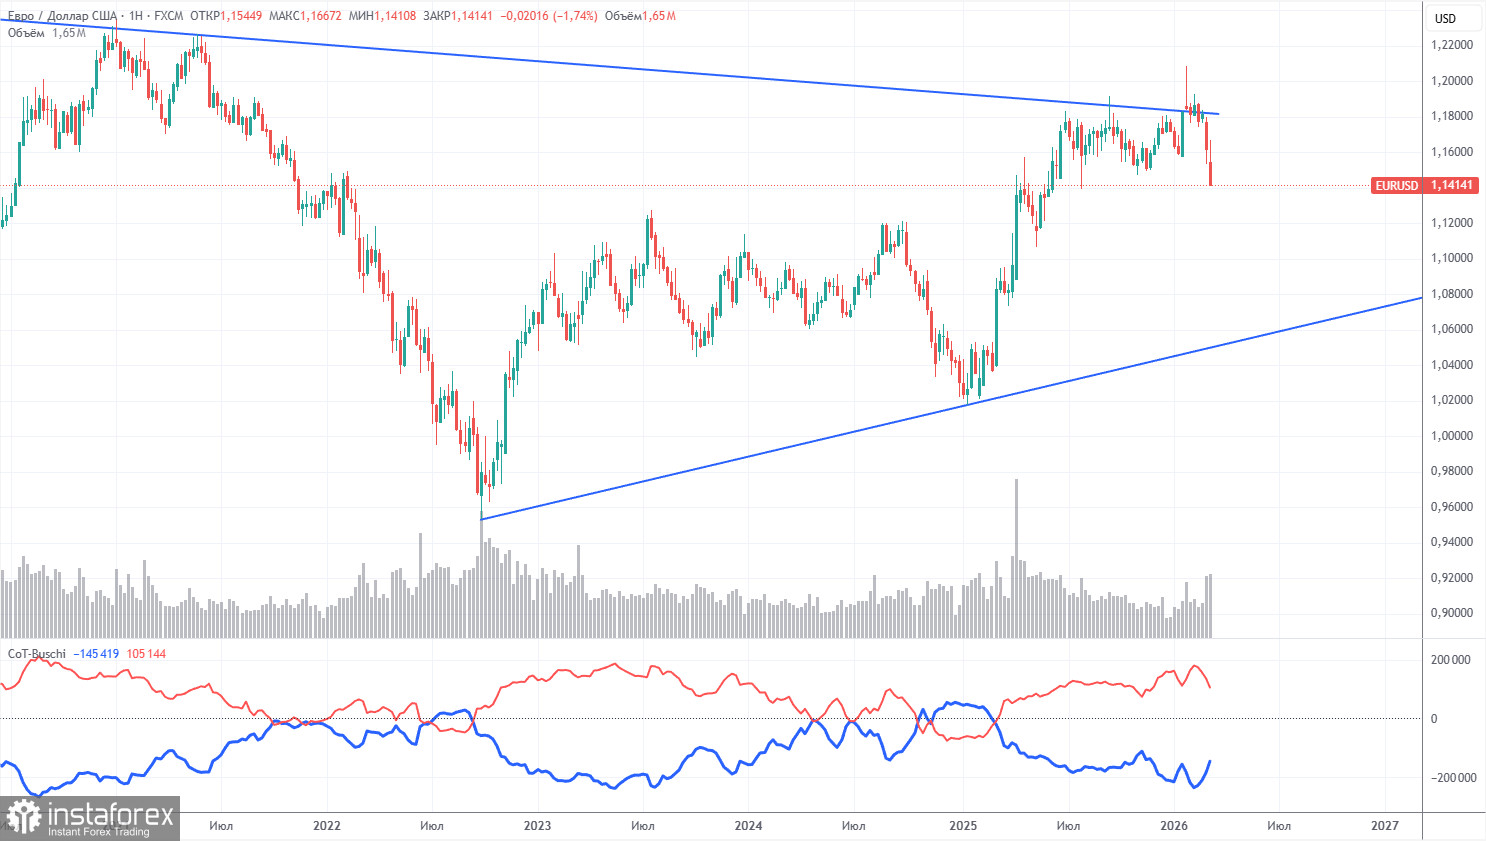
The last COT report is dated March 10. The illustration of the weekly timeframe clearly shows that the net position of non-commercial traders remains "bullish," and since Trump took office as president of the US for the second time, only the dollar has been falling. In recent weeks, the American currency has been gaining value due to geopolitics, but the long-term upward trend remains.
We still do not see any fundamental factors that would strengthen the European currency. However, there are still plenty of factors for the decline of the American dollar. The war in the Middle East made the dollar temporarily super attractive, but when this factor expires is an open question. In the long term, the euro may fall to as low as 1.06 (the trend line), but the upward trend will still be relevant.
The positioning of the red and blue lines of the indicator continues to indicate the persistence of a "bullish" trend. During the last reporting week, the number of long positions in the "Non-commercial" group decreased by 28,900, while the number of short positions decreased by 2,500. Consequently, the net position decreased by 25,400 contracts over the week.
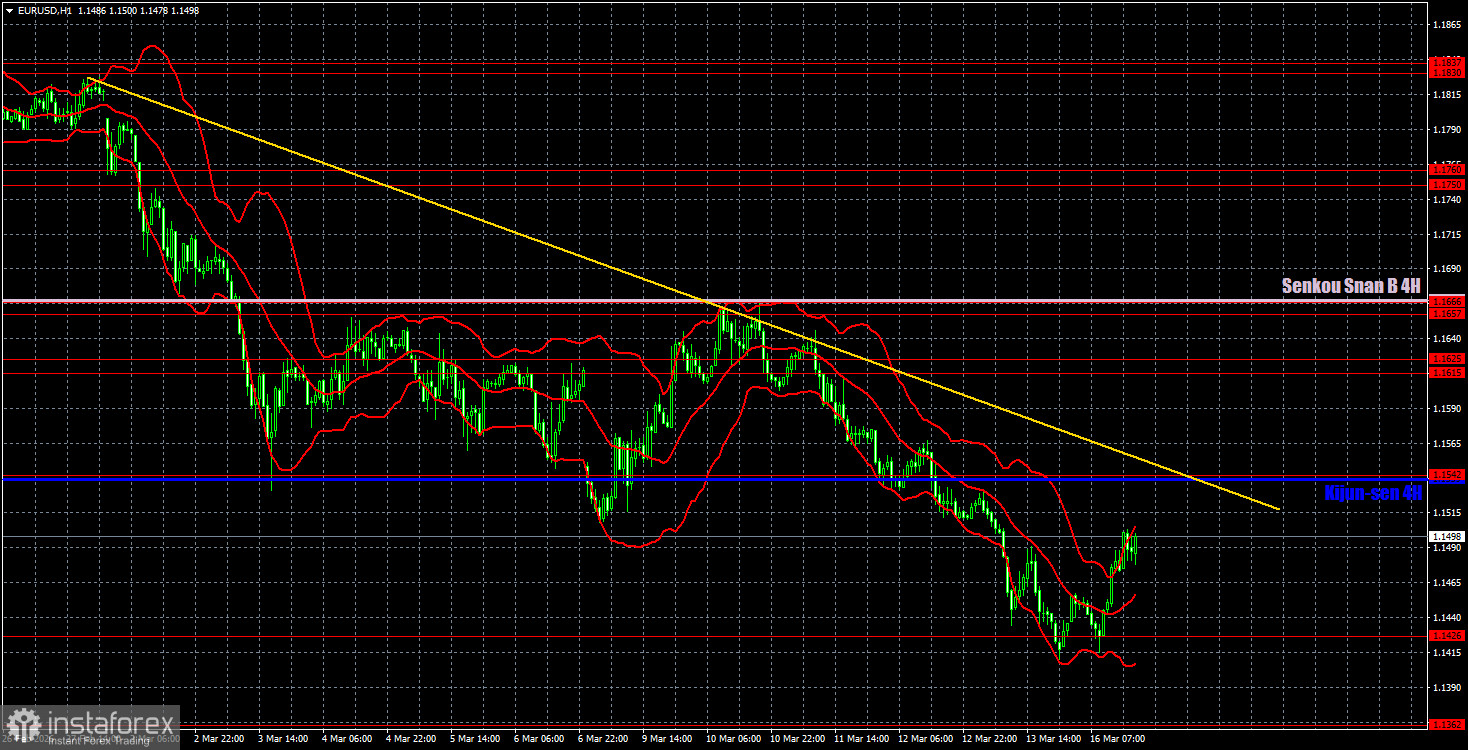
On the hourly timeframe, the EUR/USD pair continues to decline amid geopolitical events in the Middle East. Trump's statements about the imminent end of the war gave traders hope at the beginning of last week, but by midweek, it became clear there would be no quick end to the conflict. The dollar corrected slightly on Monday but may resume its rise at any moment.
For March 17, we highlight the following levels for trading: 1.1234, 1.1274, 1.1362, 1.1426, 1.1542, 1.1615-1.1625, 1.1657-1.1666, 1.1750-1.1760, 1.1830-1.1837, as well as the Senkou Span B line (1.1668) and Kijun-sen (1.1540). The Ichimoku indicator lines may move throughout the day, which should be taken into account when determining trading signals. Don't forget to set a stop-loss order to break even if the price moves in the right direction by 15 pips. This will protect against potential losses if the signal turns out to be false.
On Tuesday, Germany and the Eurozone will publish economic expectations indices (ZEW), and the US will see the weekly ADP report on employment changes. We believe that none of these three secondary reports will affect the pair's movement, except perhaps minimally and unnoticed.
On Tuesday, traders may consider new short positions if the price bounces off the Kijun-sen line, targeting 1.1426 and 1.1362. Long positions can be considered if the price consolidates above 1.1542 and the trend line, with a target area of 1.1615-1.1625.
Support and resistance price levels – thick red lines around which movement may come to an end. They are not sources of trading signals.
Kijun-sen and Senkou Span B lines – Ichimoku indicator lines transferred to the hourly timeframe from the 4-hour timeframe. They are strong lines.
Extreme levels – thin red lines from which the price previously rebounded. They are sources of trading signals.
Yellow lines – trend lines, trend channels, and any other technical patterns.
Indicator 1 on COT charts – the size of the net position of each category of traders.
Le recensioni analitiche di InstaForex ti renderanno pienamente consapevole delle tendenze del mercato! Essendo un cliente InstaForex, ti viene fornito un gran numero di servizi gratuiti per il trading efficiente.


