 Rimani
Condizioni di trading
Strumenti


The EUR/USD currency pair continued its upward movement on Tuesday and has effectively broken through the descending trendline. It is worth noting that this is not the first time in the last month and a half that the descending trendline has allowed prices to rise above it. In previous cases, the upward trend did not commence. However, nothing lasts forever, including the dollar's support from a single geopolitical factor.
In recent weeks, we have frequently mentioned that the dollar has no other supporting factors besides geopolitics. And if we dig deeper, even geopolitics does not support the dollar. What has the war in Iran contributed to the US economy? A slowdown to 0.7% and a new decline in the labor market? The Fed's refusal to lower the key rate? Rising national debt and additional expenses that Trump is trying desperately to cut via the population? The American currency has risen in recent weeks solely on its status as a "reserve currency" and "safe haven," rather than on the war in Iran or rising oil prices. Therefore, we welcome the end of the bearish trend on the hourly and 4-hour time frames, and we do not consider that the upward trends of 2025 and 2022 have concluded.
The macroeconomic background yesterday was very weak, and traders once again paid no attention to it. The ZEW indexes should have triggered a decline in the euro if the market had reacted to them.
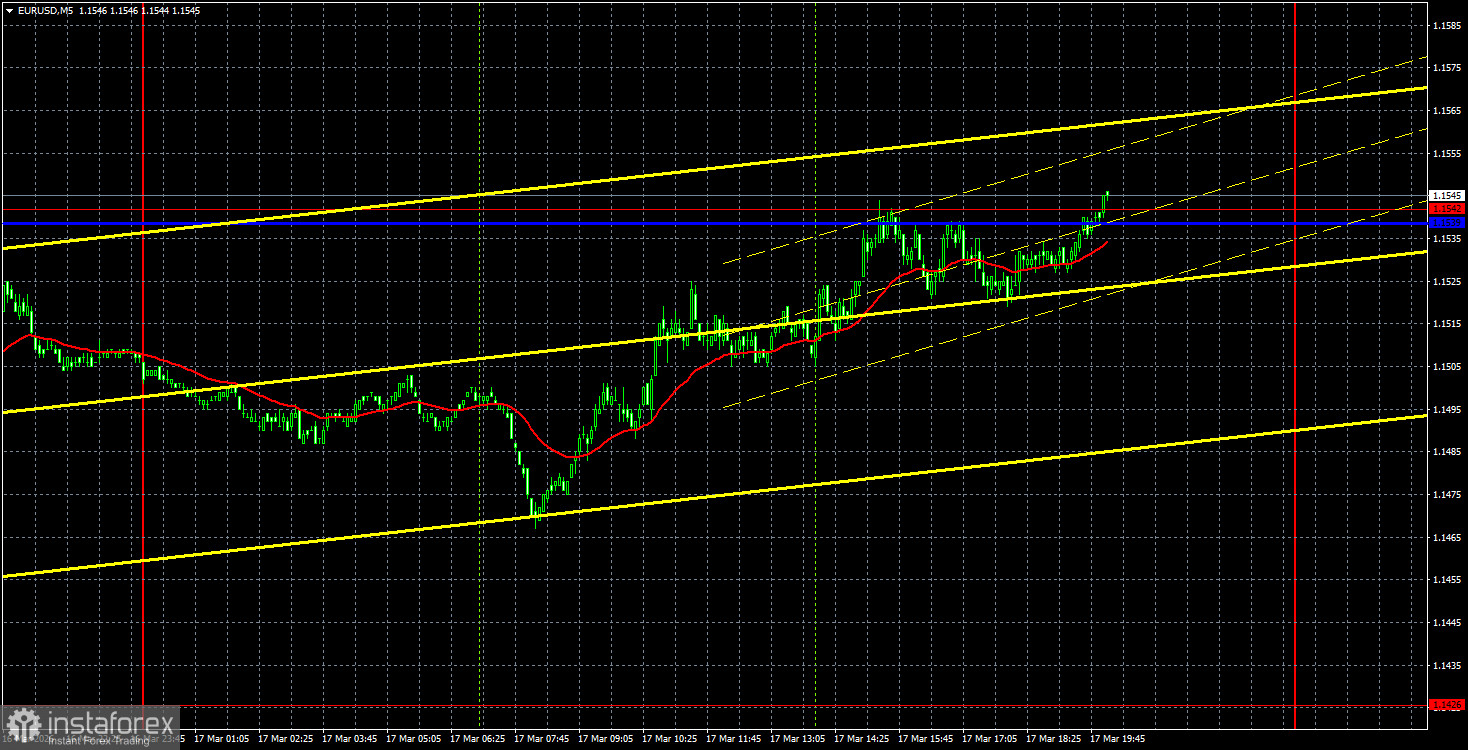
On the 5-minute time frame, there was not a single trading signal generated throughout the day yesterday. The last buy signal was formed back on Monday when the price bounced off the level of 1.1426. By the end of the day, the price reached the Kijun-sen line and the level of 1.1542, but now the trendline that has been broken is more important for the euro's prospects. We believe the euro will continue to grow, but today there is a Fed meeting in the United States...
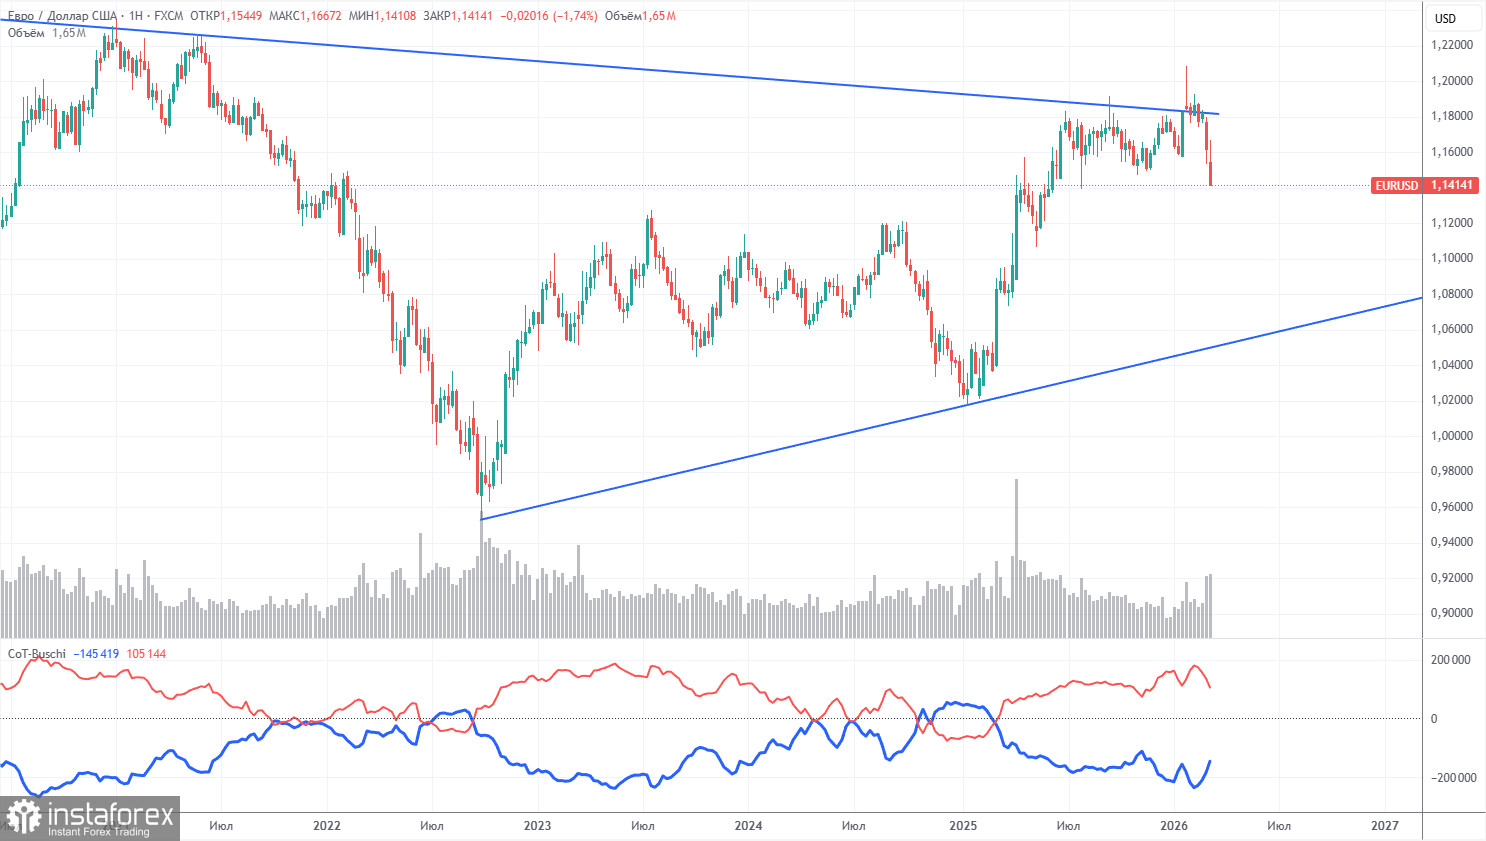
The latest COT report is dated March 10. The illustration on the weekly time frame clearly shows that the net position of non-commercial traders remains "bullish," and since Trump took office as president of the United States for the second time, only the dollar has been declining. In recent weeks, the American currency has appreciated due to geopolitical factors, but the long-term upward trend remains intact.
We still do not see any fundamental factors supporting the strengthening of the euro. However, there are plenty of factors supporting the decline of the American dollar. The war in the Middle East made the dollar temporarily super-attractive, but when that factor expires, that remains an open question. In the long term, the euro could fall to as low as 1.06 (the trendline), but the upward trend will remain relevant.
The positioning of the red and blue lines of the indicator continues to indicate the persistence of a "bullish" trend. During the last reporting week, the number of long positions for the "Non-commercial" group decreased by 28,900, while short positions decreased by 2,500. Consequently, the net position fell by 25,400 contracts over the week.
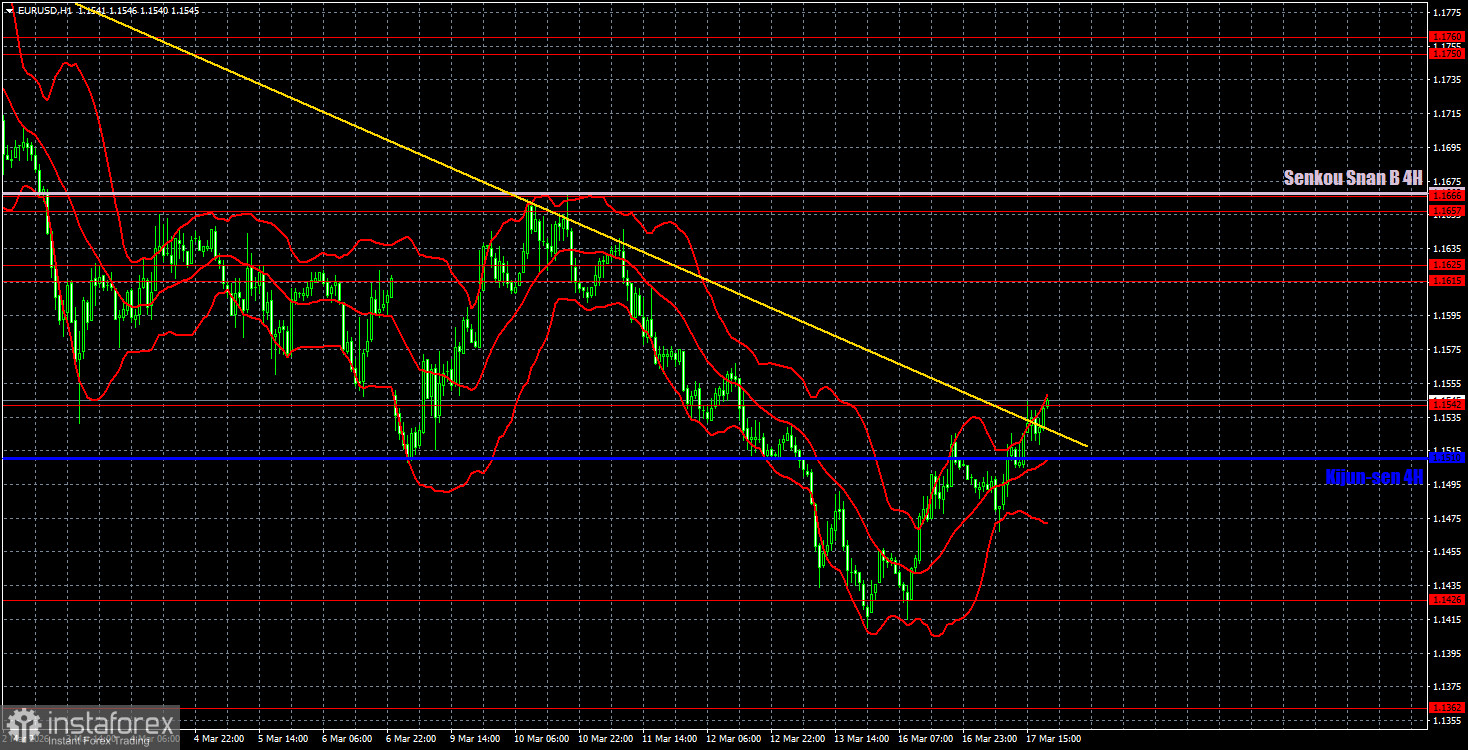
On the hourly time frame, the EUR/USD pair may complete its downward trend this week. A new escalation in the Middle East, new shocks in the oil or gas market, or an expansion of the conflict beyond the Middle East could provoke a new wave of dollar purchases. Similarly, unexpectedly hawkish rhetoric from the Fed this evening could impact the dollar. However, we once again believe that the US dollar has exhausted the maximum opportunities available to it. Globally, nothing has changed for its prospects in 2026.
For March 18, we identify the following levels for trading: 1.1234, 1.1274, 1.1362, 1.1426, 1.1542, 1.1615-1.1625, 1.1657-1.1666, 1.1750-1.1760, 1.1830-1.1837, as well as the Senkou Span B line (1.1668) and the Kijun-sen line (1.1510). The lines of the Ichimoku indicator may shift throughout the day, which should be taken into account when determining trading signals. Don't forget to set a Stop Loss order to break even if the price moves in the right direction by 15 pips. This will safeguard against potential losses if the signal turns out to be false.
On Wednesday, the European Union is scheduled to publish the second estimate of February inflation, which is expected to be of little significance. In the United States, the Producer Price Index is also not expected to carry much weight. However, in the evening, there will be announcements on the Fed meeting results, the dot plot schedule, and Jerome Powell's speech.
On Wednesday, traders may consider new short positions in the event of a rebound from or a price consolidation below the Kijun-sen line, targeting 1.1426. Long positions can be considered in the event of a fixation above the 1.1542 level and the trendline, targeting the area of 1.1615-1.1625.
Price levels of support and resistance (resistance/support) – thick red lines, around which movement may conclude. These are not sources of trading signals.
Kijun-sen and Senkou Span B lines – lines from the Ichimoku indicator transferred to the hourly time frame from the 4-hour. These are strong lines.
Extremum levels – thin red lines, from which the price has previously bounced. These are sources of trading signals.
Yellow lines – trendlines, trending channels, and any other technical patterns.
Indicator 1 on COT charts – the size of the net position of each category of traders.
Le recensioni analitiche di InstaForex ti renderanno pienamente consapevole delle tendenze del mercato! Essendo un cliente InstaForex, ti viene fornito un gran numero di servizi gratuiti per il trading efficiente.


