 Rimani
Condizioni di trading
Strumenti


The EUR/USD currency pair continued its upward movement on Wednesday amid market expectations of an imminent end to the war in the Middle East. The market successfully ignored macroeconomic data, which entirely supported the US dollar this time. Overnight, US President Donald Trump gave a speech that sent the EUR/USD pair into a tailspin. In general, we warned that there are currently no real signs of the war in Iran coming to an end. There are only talks, intentions, and willingness. It is unknown whether real negotiations between Tehran and Washington even exist. The negotiating positions expressed by both sides are as far apart as the Earth is from the Moon. Both sides want to end the war, but each wants to do so on its own terms. Thus, it is still very premature to say that the crisis in the Middle East is subsiding. Overall, Trump did not report anything that indicated the imminent conclusion of the war. This is why the dollar rose again.
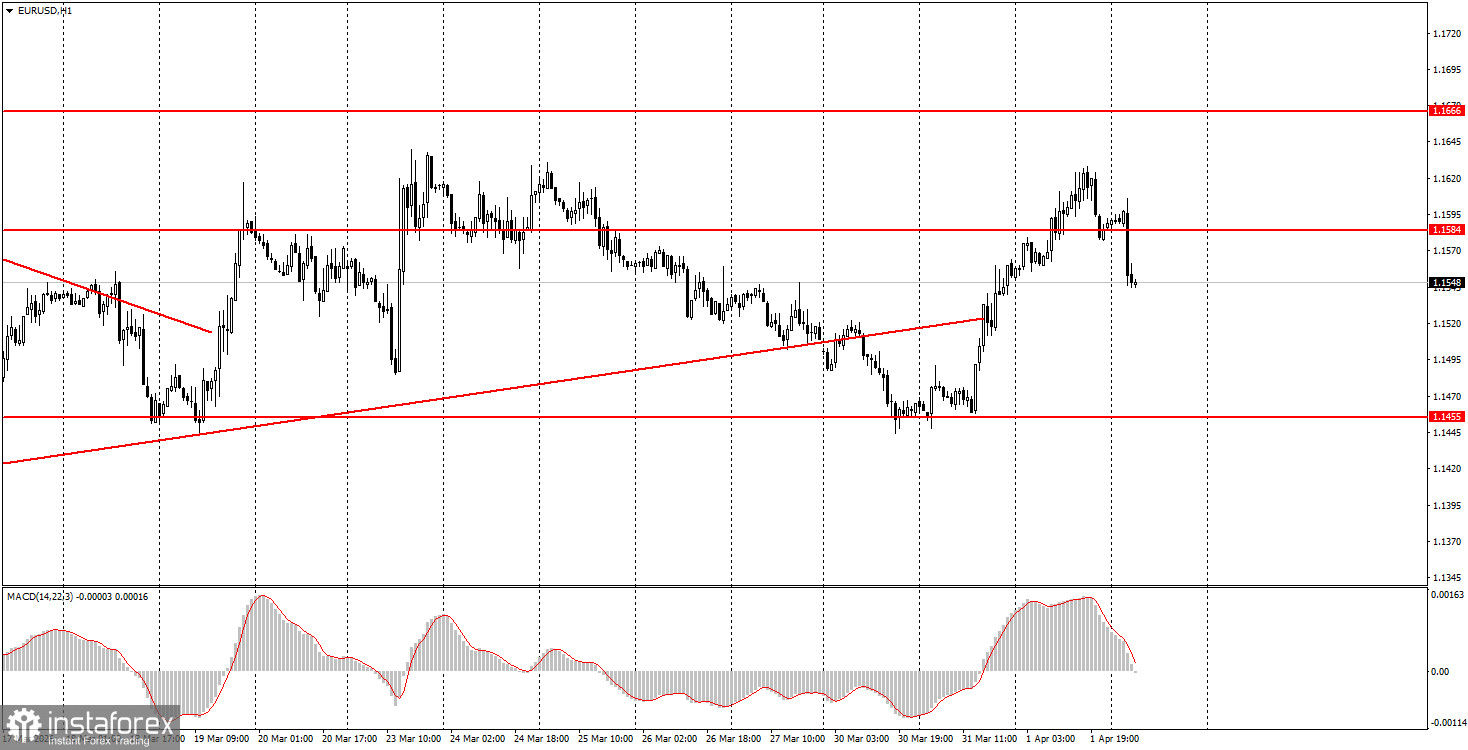
On the hourly timeframe, the ascending trendline has been broken, and we again did not see any significant upward trend. Moreover, over the last two days, the euro has been rising actively, but it fell again last night. The market continues to trade solely on geopolitics and emotions. Therefore, the "rollercoaster" may continue for a long time. Trump constantly provokes either crashes or surges in the US dollar.
On Thursday, beginner traders may consider short positions if the price consolidates below the 1.1527-1.1531 area, targeting 1.1455-1.1474. A price bounce from the 1.1527-1.1531 area will allow for long positions with a target of 1.1584-1.1591.
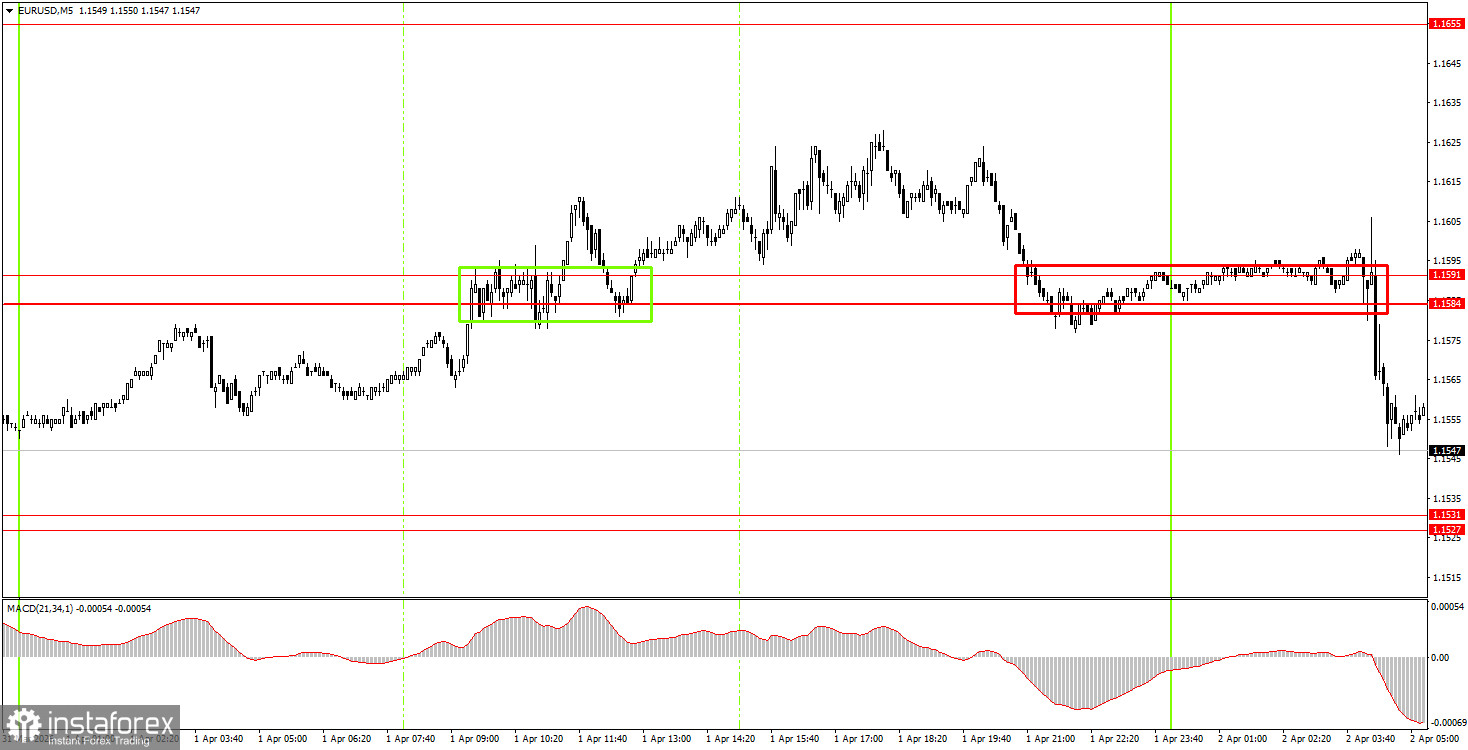
On the 5-minute timeframe, levels to consider include 1.1267-1.1292, 1.1354-1.1363, 1.1413, 1.1455-1.1474, 1.1527-1.1531, 1.1584-1.1591, 1.1655-1.1666, 1.1745-1.1754, 1.1830-1.1837, and 1.1899-1.1908. On Thursday, there are no important events scheduled in the European Union, while in the US, only a secondary report on unemployment claims will be released.
Price levels of support and resistance are levels that serve as targets when opening buys or sells. Take Profit levels can be placed around them.
Red lines represent channels or trend lines that show the current trend and indicate the direction in which it is preferable to trade now.
The MACD indicator (14,22,3) – the histogram and the signal line – is a supporting indicator that can also be used as a source of signals.
Important speeches and reports (always included in the news calendar) can significantly affect the movement of the currency pair. Therefore, during their release, trading should be done with utmost caution, or traders should exit the market to avoid sharp price reversals against the previous movement.
Beginning traders in the forex market should remember that not every trade can be profitable. Developing a clear strategy and effective money management are the keys to long-term trading success.
Le recensioni analitiche di InstaForex ti renderanno pienamente consapevole delle tendenze del mercato! Essendo un cliente InstaForex, ti viene fornito un gran numero di servizi gratuiti per il trading efficiente.


