 Rimani
Condizioni di trading
Strumenti


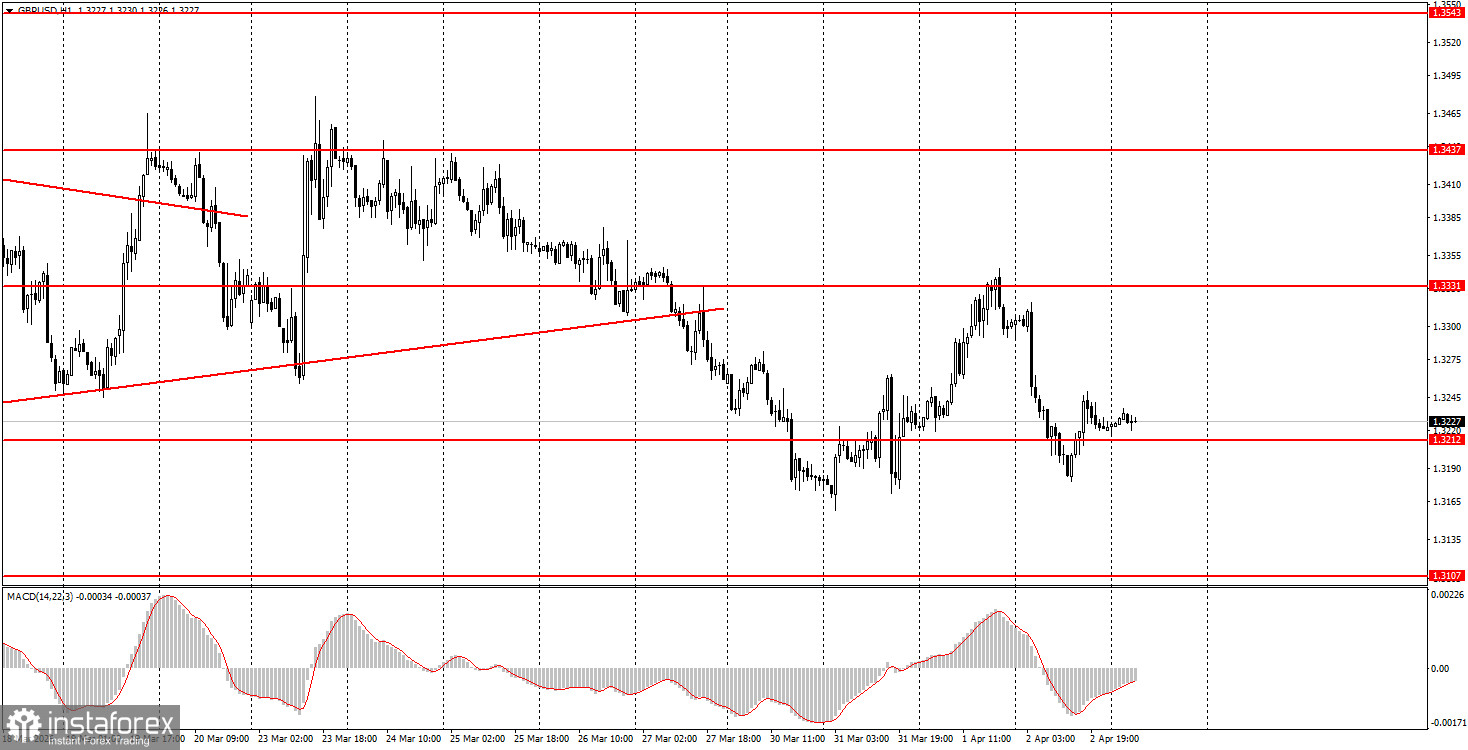
The GBP/USD pair also posted a strong decline on Thursday, driven by Donald Trump's new threats towards Iran. There was no macroeconomic background throughout the day yesterday. Formally, a descending trend line can now be drawn, but it will need to be adjusted daily. The price continues to swing back and forth with relatively high volatility, reacting to any news related to geopolitics. Moreover, traders are responding selectively to news. Last week, from Tuesday to Thursday, the market largely ignored Trump's statements as it lost trust in him. However, this week, for unknown reasons, that trust seems to have been reinstated, causing the GBP/USD pair to swing back and forth once again. Today, the US will publish important labor market and unemployment reports, which could provoke any movement.
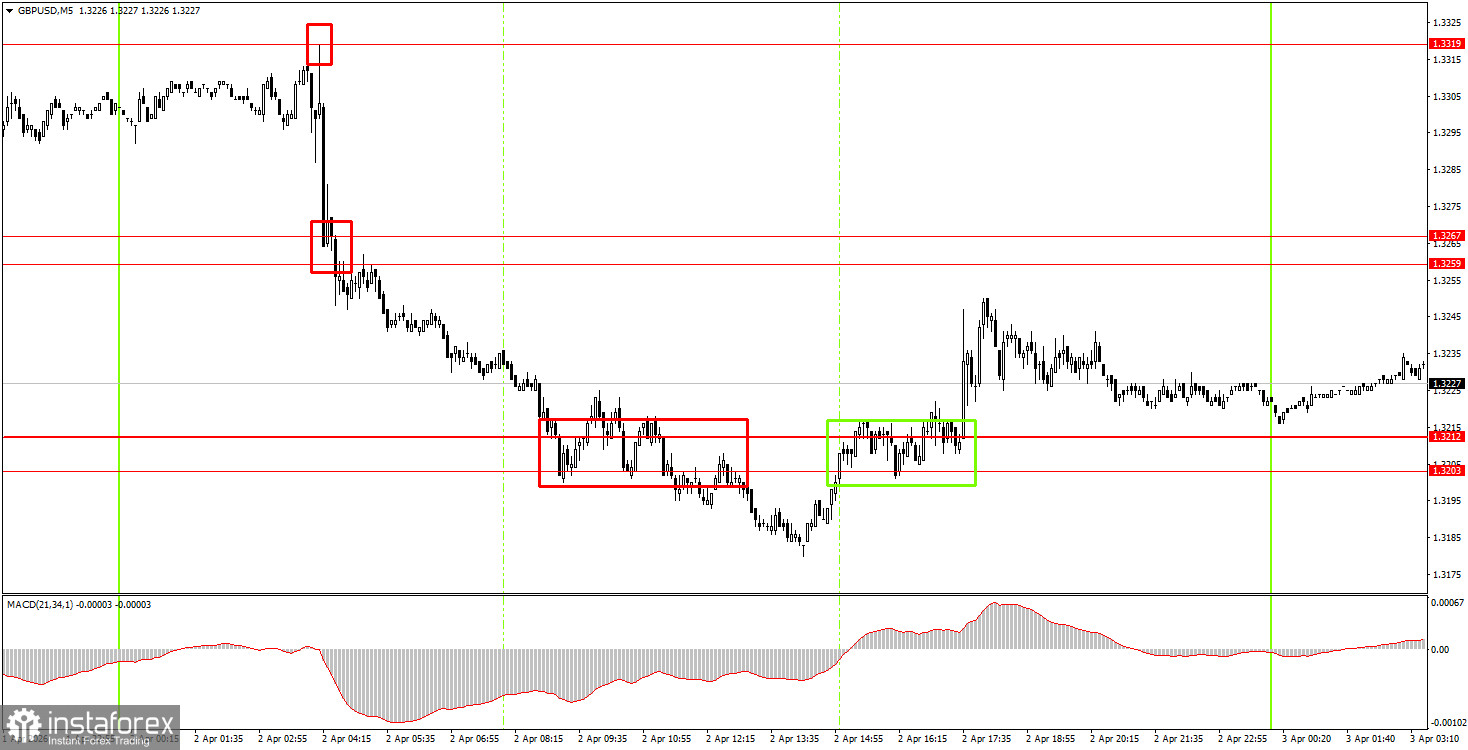
On the 5-minute timeframe, three trading signals were formed on Thursday. Overnight, the pair surpassed the area of 1.3259-1.3267, but by the time the European trading session opened, the price had moved too far from the point of formation. The next signal was formed when surpassing the area of 1.3203-1.3212, but it turned out to be false. During the American trading session, a Buy signal formed in the same area, allowing novice traders to earn up to 10-20 pips.
On the hourly timeframe, the latest upward trend in the GBP/USD pair has been broken. There are no global grounds for medium-term growth in the dollar, so we expect a revival of the global upward trend from 2025 in 2026. However, this requires that geopolitical tensions in the world begin to ease, because the dollar is currently in demand solely on geopolitical grounds.
On Friday, beginner traders may open new short positions if the price consolidates below the 1.3203-1.3212 range, targeting 1.3096-1.3107. A bounce from the area of 1.3203-1.3212 will allow for long positions with a target of 1.3259-1.3267.
On the 5-minute timeframe, levels to consider for trading now include: 1.3096-1.3107, 1.3203-1.3212, 1.3259-1.3267, 1.3319-1.3331, 1.3403-1.3407, 1.3437-1.3446, 1.3484-1.3489, 1.3529-1.3543, 1.3643-1.3652, 1.3695, and 1.3741-1.3751. Today, there are no important events scheduled in the UK, while in the US, critical Non-Farm Payroll and unemployment reports will be released. These reports could provoke either a strong movement in either direction or a rather weak market reaction.
Price levels of support and resistance are levels that serve as targets when opening buys or sells. Take Profit levels can be placed around them.
Red lines represent channels or trend lines that show the current trend and indicate the direction in which it is preferable to trade now.
The MACD indicator (14,22,3) – the histogram and the signal line – is a supporting indicator that can also be used as a source of signals.
Important speeches and reports (always included in the news calendar) can significantly affect the movement of the currency pair. Therefore, during their release, trading should be done with utmost caution, or traders should exit the market to avoid sharp price reversals against the previous movement.
Beginning traders in the forex market should remember that not every trade can be profitable. Developing a clear strategy and effective money management are the keys to long-term trading success.
Le recensioni analitiche di InstaForex ti renderanno pienamente consapevole delle tendenze del mercato! Essendo un cliente InstaForex, ti viene fornito un gran numero di servizi gratuiti per il trading efficiente.


