 Rimani
Condizioni di trading
Strumenti


The EUR/USD currency pair attempted to continue its upward movement on Thursday, but there were both reasons to support it and reasons to oppose it simultaneously. On the one hand, the market is still optimistic about the potential end of the war in the Middle East. On the other hand, military actions are ongoing, and the actual ceasefire reached on Wednesday did not last even a day. Yesterday, another disappointing GDP report for the fourth quarter was published, which should have prompted a decline in the dollar. However, the market has been ignoring the macroeconomic backdrop for the past two months. Thus, another upward trend began on the hourly time frame, but it could end just as quickly as the previous ones if the situation in the Middle East does not continue moving towards de-escalation and lasting peace.
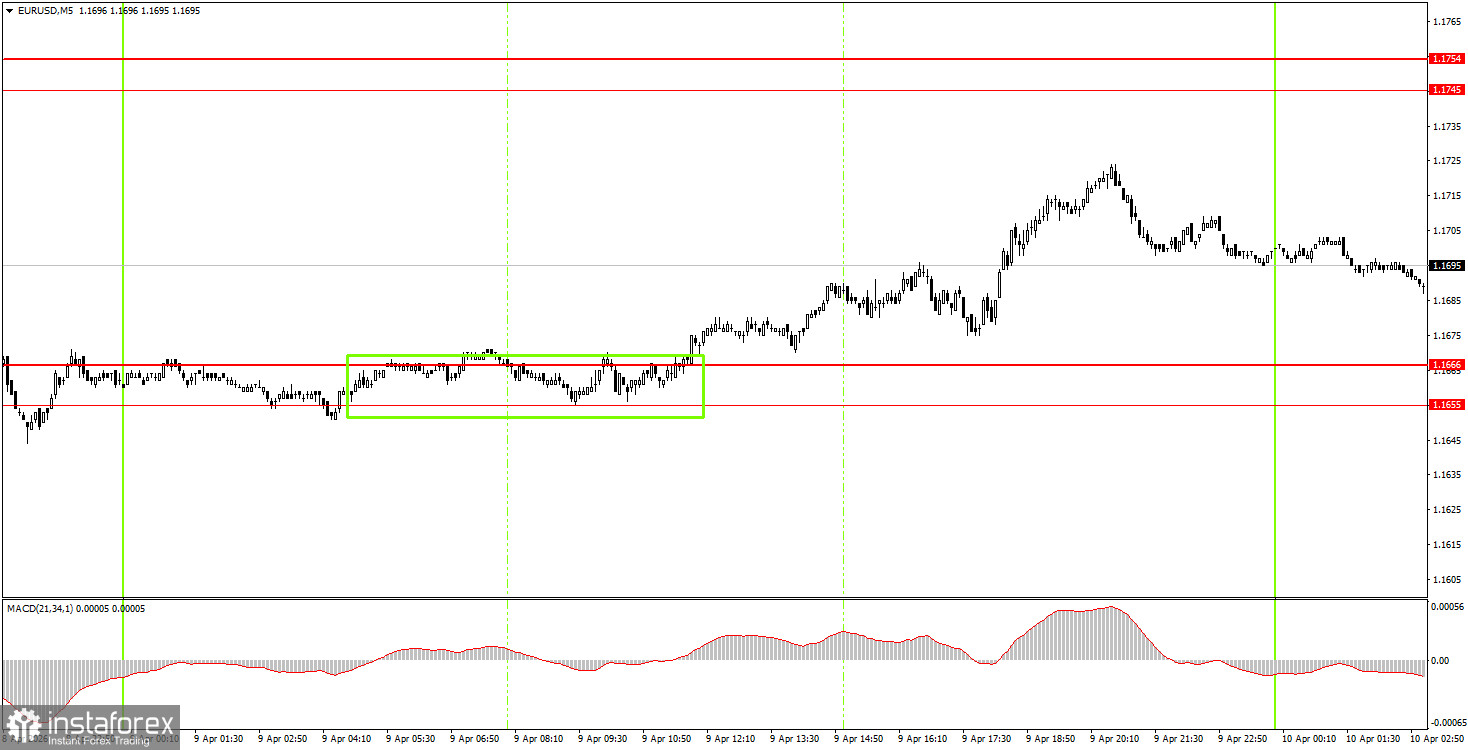
On the 5-minute time frame, only one trading signal was generated on Thursday. During the European trading session, the price broke through the 1.1655-1.1666 area, after which the pair moved in the correct direction by about 30-40 pips. These 30-40 pips could be easily earned by beginner traders, as the signal was simple and clear, and the movement of the pair was quite straightforward.
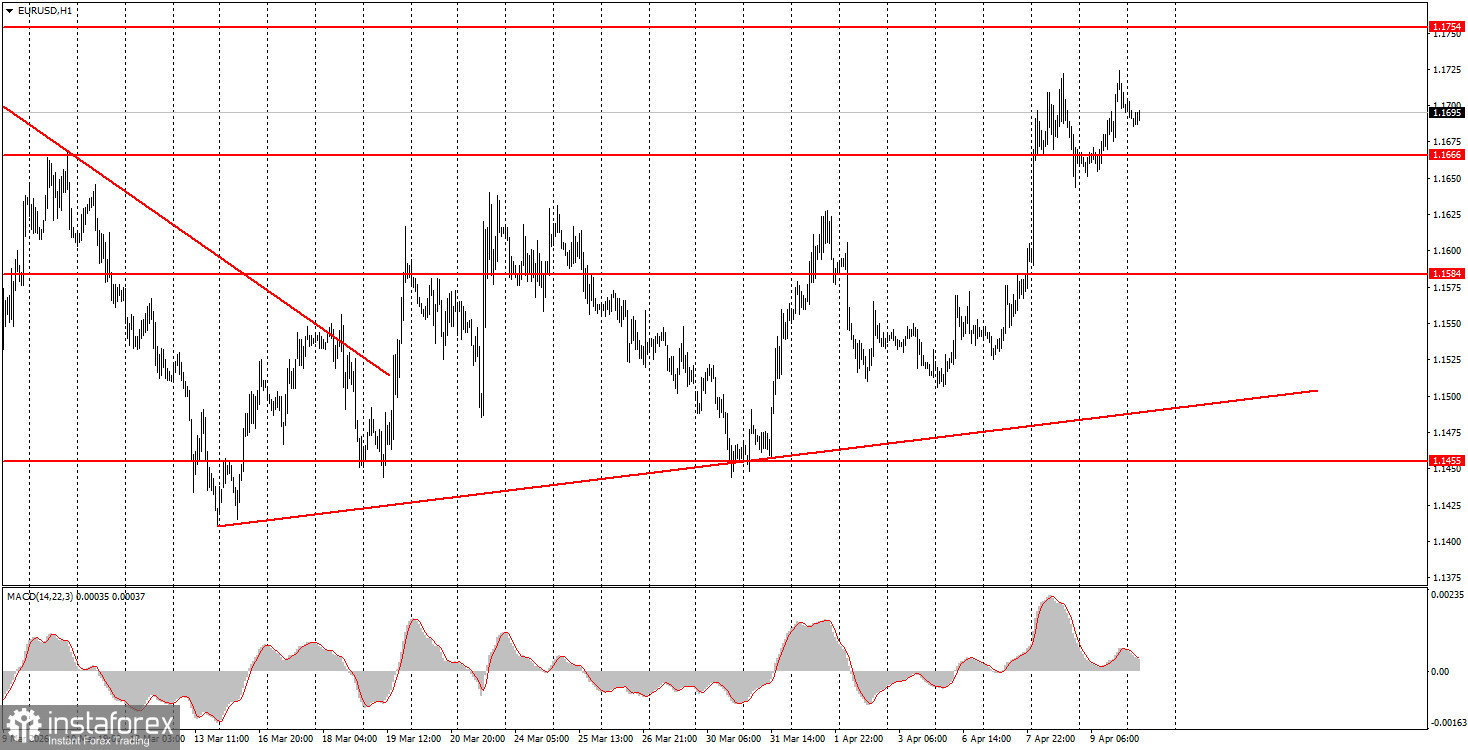
On the hourly time frame, the upward trend has resumed due to geopolitical factors, and the pair's future movements will depend on the same factors. The market continues to trade solely based on events in the Middle East and emotions. Therefore, "rollercoaster" movements may continue for a long time, while macroeconomic, technical, and fundamental factors become irrelevant. Trump constantly provokes both drops and surges in the U.S. dollar.
On Friday, beginner traders may consider short positions if the price consolidates below the 1.1655-1.1666 area, targeting 1.1584-1.1591. A new price bounce from the area of 1.1655-1.1666 will allow for long positions to be opened with targets at 1.1745-1.1754.
On the 5-minute time frame, consider trading at the following levels: 1.1267-1.1292, 1.1354-1.1363, 1.1413, 1.1455-1.1474, 1.1527-1.1531, 1.1584-1.1591, 1.1655-1.1666, 1.1745-1.1754, 1.1830-1.1837, 1.1899-1.1908. On Friday, a second inflation estimate for March will be published in Germany, but this report is entirely secondary. In the U.S., the "report of the week"—inflation for March in a single estimate—will be released. Inflation is currently directly influencing the Fed's monetary policy, but the market may also ignore this report.
Price levels of support and resistance are levels that serve as targets when opening buys or sells. Take Profit levels can be placed around them.
Red lines represent channels or trend lines that show the current trend and indicate the direction in which it is preferable to trade now.
The MACD indicator (14,22,3) – the histogram and the signal line – is a supporting indicator that can also be used as a source of signals.
Important speeches and reports (always included in the news calendar) can significantly affect the movement of the currency pair. Therefore, during their release, trading should be done with utmost caution, or traders should exit the market to avoid sharp price reversals against the previous movement.
Beginning traders in the forex market should remember that not every trade can be profitable. Developing a clear strategy and effective money management are the keys to long-term trading success.
Le recensioni analitiche di InstaForex ti renderanno pienamente consapevole delle tendenze del mercato! Essendo un cliente InstaForex, ti viene fornito un gran numero di servizi gratuiti per il trading efficiente.


