 Rimani
Condizioni di trading
Strumenti


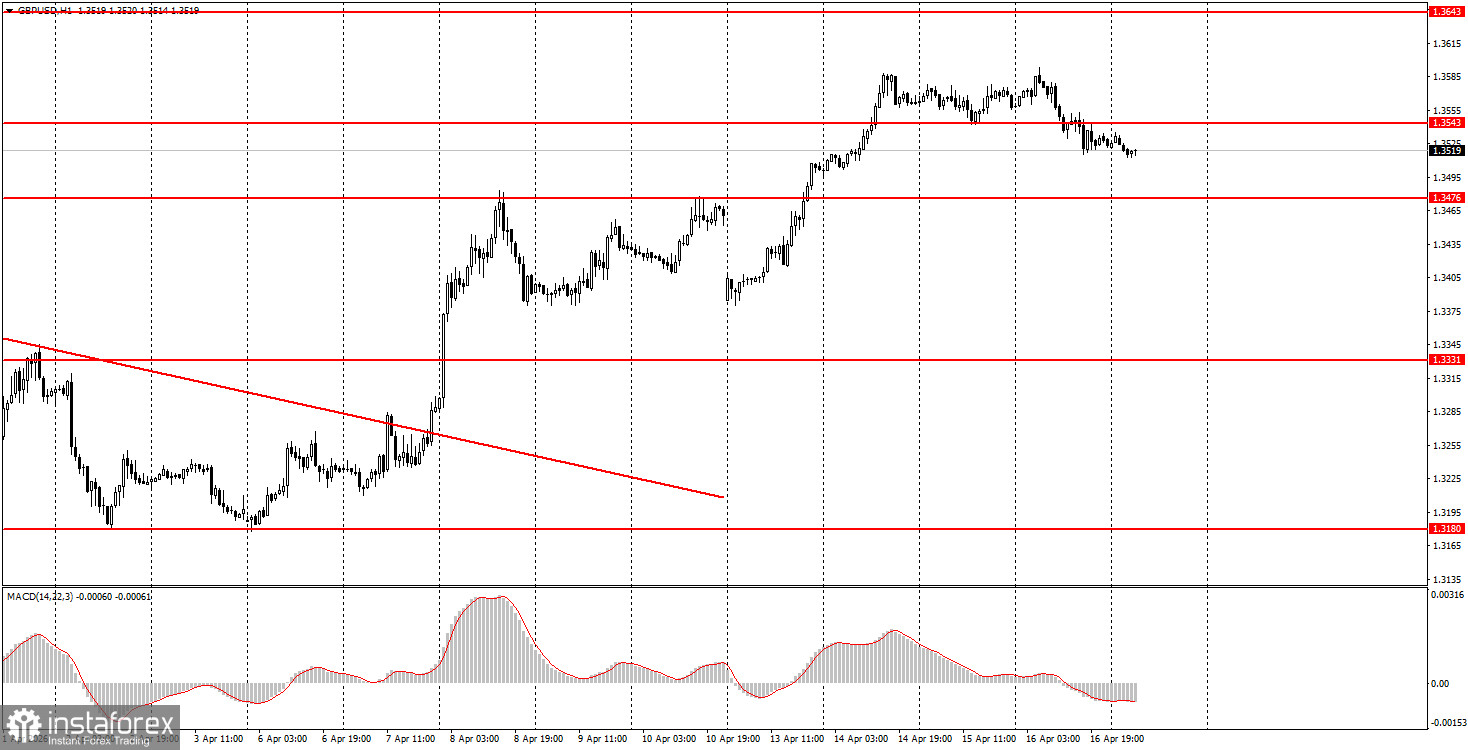
The GBP/USD pair also experienced a slight correction on Thursday, consolidating below 1.3543. The decline of the British currency was not triggered by geopolitical, fundamental, or macroeconomic factors. There was no significant geopolitical news on Thursday, and fundamental news was absent as well. Among the macroeconomic reports, we can note two in the UK that came in stronger than forecasts and, accordingly, should have prompted a rise in the British pound rather than a decline. GDP volumes increased by 0.5% in February, and industrial production also rose by 0.5%. Traders had anticipated lower values. Thus, the market continues to ignore macroeconomic indicators. After 1.5 weeks of growth driven by reduced tensions in the Middle East, the market has paused. Now, everything depends on how long the ceasefire lasts and how successful the negotiations between Iran and the U.S. are.
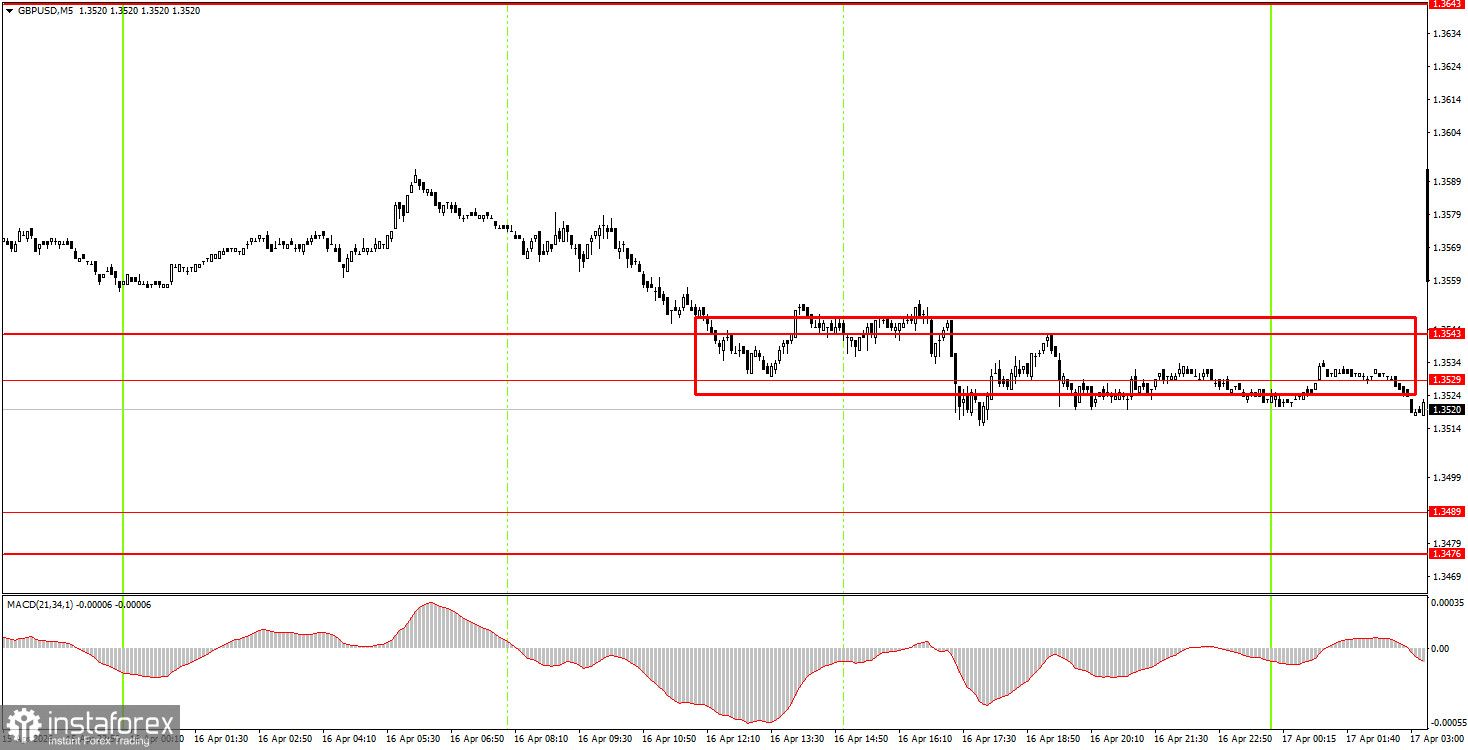
On the 5-minute timeframe, a single trading signal was formed on Thursday. It was effectively formed for 15 hours. The price consolidated below the 1.3529-1.3543 area only last night. However, such a contradictory signal is also a signal. Today, the British pound may continue to decline; however, volatility is likely to remain low.
On the hourly timeframe, the GBP/USD pair continues to form an upward trend. There are no significant foundations for the medium-term growth of the dollar, so we expect the global upward trend to resume in 2026. This requires that geopolitical tensions worldwide continue to decrease. However, we believe that without a significant escalation in the Middle East, the dollar will no longer be able to sustain the growth it has shown over the last two months.
On Friday, novice traders may maintain or open short positions, as the price has consolidated below the 1.3529-1.3543 area, targeting 1.3476-1.3489. Consolidation above the area of 1.3529-1.3543 will allow for opening long positions with targets at 1.3643-1.3652.
On the 5-minute timeframe, levels to consider include 1.3175-1.3180, 1.3259-1.3267, 1.3319-1.3331, 1.3380-1.3386, 1.3476-1.3489, 1.3529-1.3543, 1.3643-1.3652, 1.3695, and 1.3741-1.3751. On Friday, there are no significant events or reports scheduled in the UK or the U.S. Thus, the hope rests solely on geopolitical news that may arrive closer to the evening. Volatility on the last trading day of the week, absent strong geopolitical factors, will be low.
Price levels of support and resistance are levels that serve as targets when opening buys or sells. Take Profit levels can be placed around them.
Red lines represent channels or trend lines that show the current trend and indicate the direction in which it is preferable to trade now.
The MACD indicator (14,22,3) – the histogram and the signal line – is a supporting indicator that can also be used as a source of signals.
Important speeches and reports (always included in the news calendar) can significantly affect the movement of the currency pair. Therefore, during their release, trading should be done with utmost caution, or traders should exit the market to avoid sharp price reversals against the previous movement.
Beginning traders in the forex market should remember that not every trade can be profitable. Developing a clear strategy and effective money management are the keys to long-term trading success.
Le recensioni analitiche di InstaForex ti renderanno pienamente consapevole delle tendenze del mercato! Essendo un cliente InstaForex, ti viene fornito un gran numero di servizi gratuiti per il trading efficiente.


