 Rimani
Condizioni di trading
Strumenti


The EUR/USD currency pair traded with low volatility on Tuesday in a corrective manner, with the market ignoring not only the macroeconomic and fundamental backdrop but also the geopolitical context. It should be noted that there have been no significant geopolitical events recently. The geopolitical backdrop is limited to numerous reports of negotiations, agreements, and mutual threats between Iran and the US. For example, just yesterday, it was reported that the second round of negotiations (which was supposed to take place over the weekend) would occur on Wednesday. However, late on Wednesday night, Iran again stated that negotiations are impossible until Washington lifts the blockade of Iranian ports and the Strait of Hormuz. As a result, the market is simply not reacting to the constant influx of insider information and reports from individual journalists "close to the source," and is choosing to wait for events rather than gossip. As we expected, the EUR/USD pair is set for a correction this week.
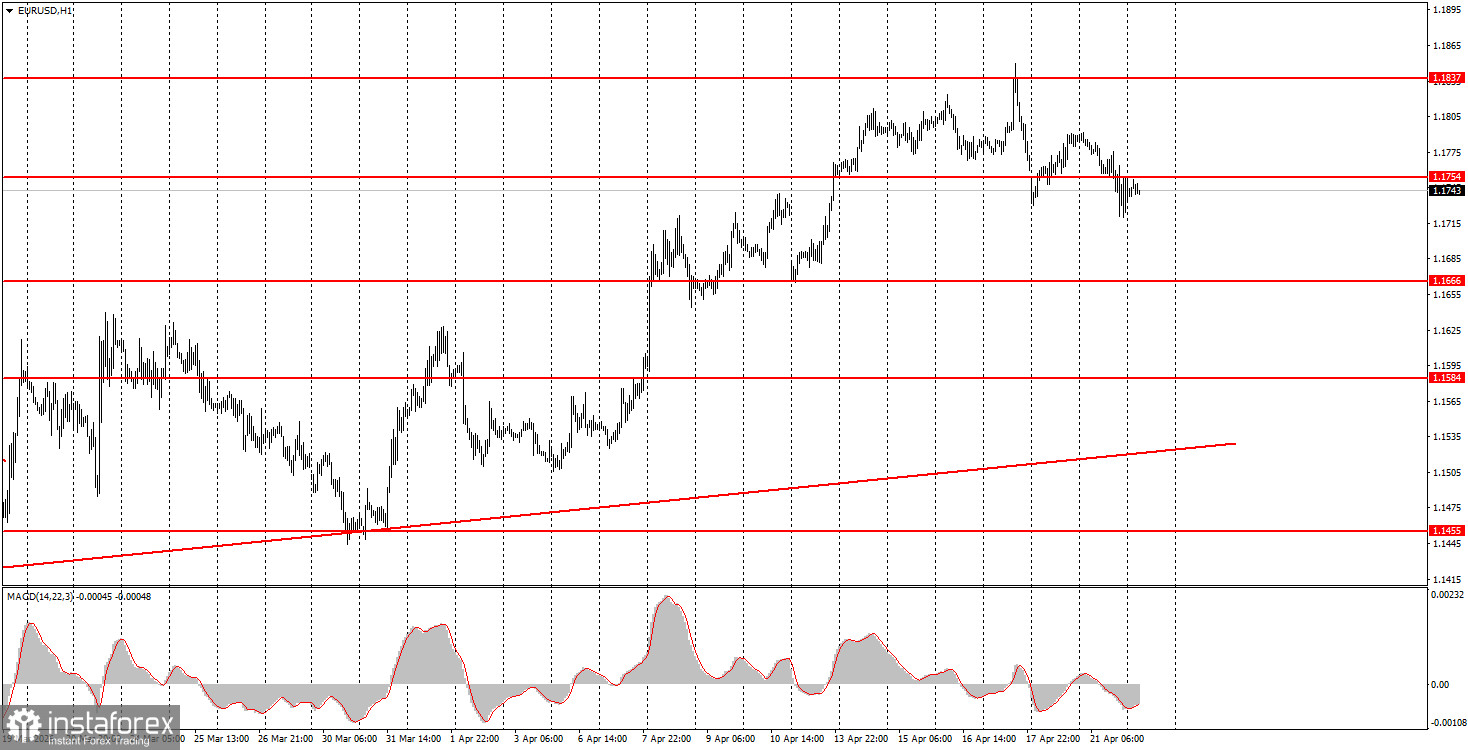
On the hourly timeframe, the upward trend remains intact. For two consecutive weeks, the market sold off the dollar, while geopolitical factors have somewhat receded in importance. However, geopolitics is worsening again, so this week, the US dollar may once again be in demand as a safe asset. We believe a correction is possible, but in any case, traders have technical levels to trade, and movements will depend on developments in the Middle East.
On Wednesday, beginner traders may maintain short positions after the price settles below the 1.1745-1.1754 area, targeting 1.1655-1.1666. New long positions can be considered if the price settles above the area of 1.1745-1.1754, targeting 1.1830-1.1837.
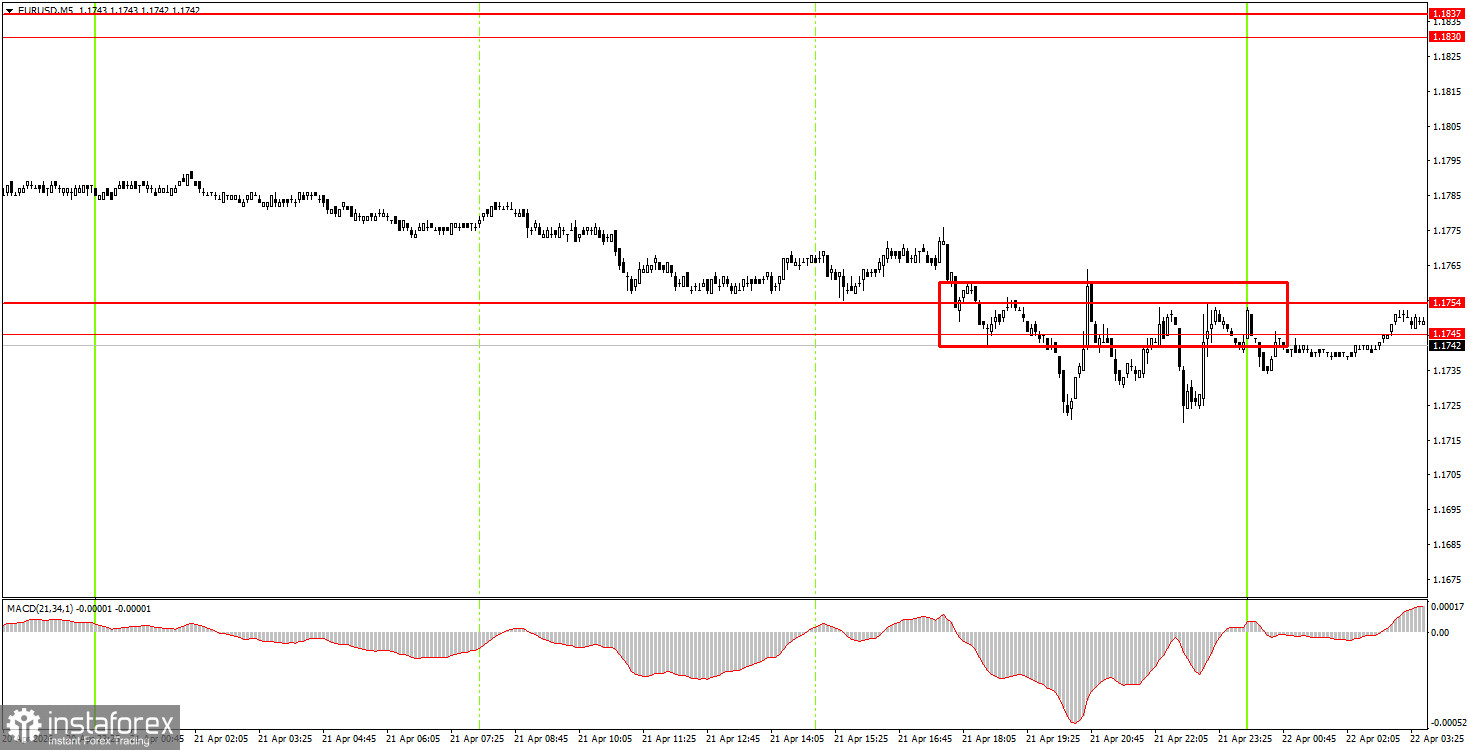
On the 5-minute timeframe, levels to watch include 1.1354-1.1363, 1.1413, 1.1455-1.1474, 1.1527-1.1531, 1.1584-1.1591, 1.1655-1.1666, 1.1745-1.1754, 1.1830-1.1837, and 1.1899-1.1908. On Wednesday, European Central Bank President Christine Lagarde will be speaking in the Eurozone; she has already spoken earlier this week. Her speech on Monday did not elicit any market reaction.
Price levels of support and resistance are levels that serve as targets when opening buys or sells. Take Profit levels can be placed around them.
Red lines represent channels or trend lines that show the current trend and indicate the direction in which it is preferable to trade now.
The MACD indicator (14,22,3) – the histogram and the signal line – is a supporting indicator that can also be used as a source of signals.
Important speeches and reports (always included in the news calendar) can significantly affect the movement of the currency pair. Therefore, during their release, trading should be done with utmost caution, or traders should exit the market to avoid sharp price reversals against the previous movement.
Beginning traders in the forex market should remember that not every trade can be profitable. Developing a clear strategy and effective money management are the keys to long-term trading success.
Le recensioni analitiche di InstaForex ti renderanno pienamente consapevole delle tendenze del mercato! Essendo un cliente InstaForex, ti viene fornito un gran numero di servizi gratuiti per il trading efficiente.


