 Rimani
Condizioni di trading
Strumenti


On Friday, the GBP/USD pair also moved higher, which could have been triggered by the UK retail sales report. Retail sales exceeded economists' predictions. However, in practice, the market has been ignoring almost the entire macroeconomic backdrop for the past two months, and last week, it disregarded far more significant British reports on inflation and unemployment on Wednesday and Thursday. Thus, there are practically no grounds to believe that the market was reacting to the retail sales report by buying the pound.
It is also noteworthy that on Friday, a report emerged about Foreign Minister Abbas Araqchi flying to Pakistan, which the market interpreted as preparation for a second round of negotiations. However, these negotiations did not take place over the weekend, as Tehran once again officially declined to meet with U.S. representatives. The influence of geopolitics diminished three weeks ago, so the British pound is currently in a much more favorable position than the dollar.
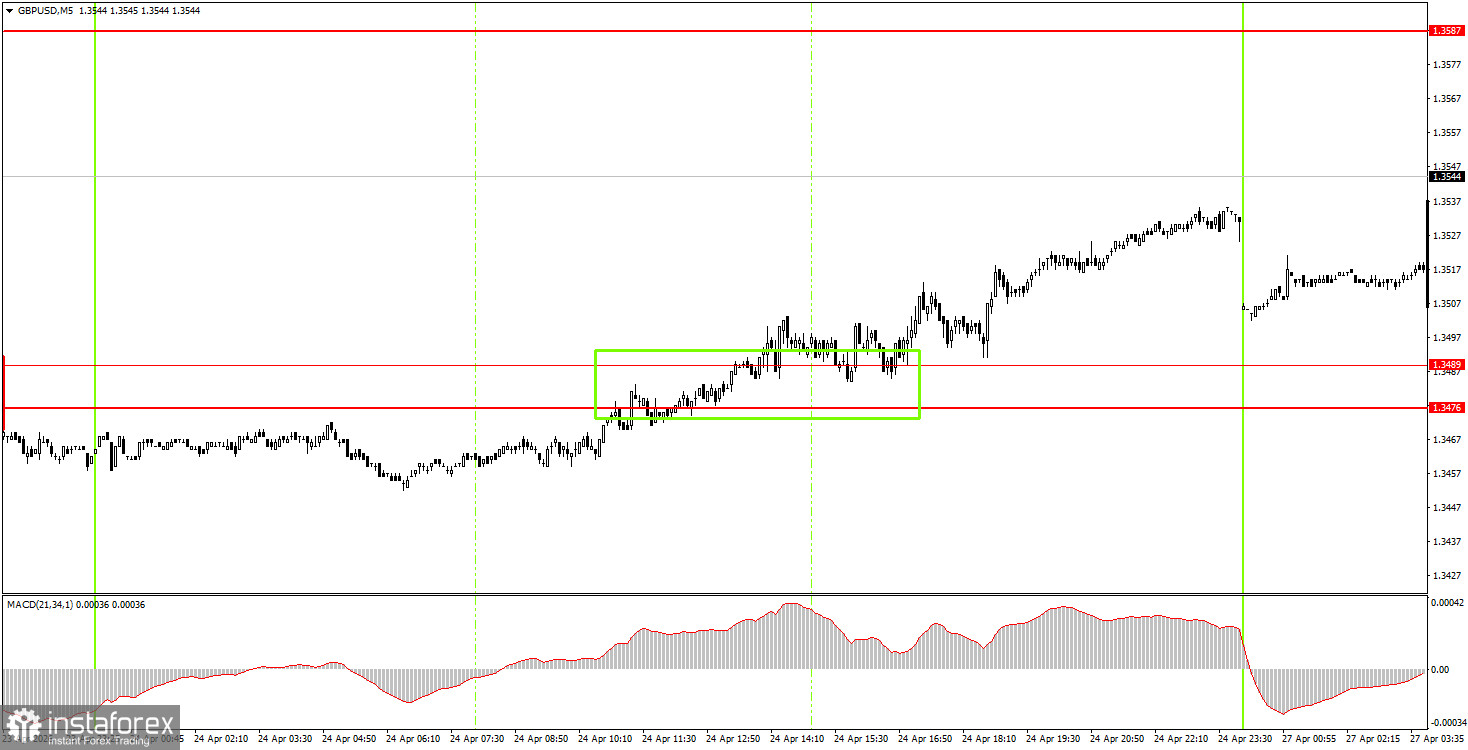
On the 5-minute timeframe, only one trading signal was formed on Friday. During the European trading session, the price broke above the 1.3476-1.3489 range, allowing beginner traders to open long positions. By the end of the day, the pair moved up about 30 pips, which beginner traders could easily capitalize on.
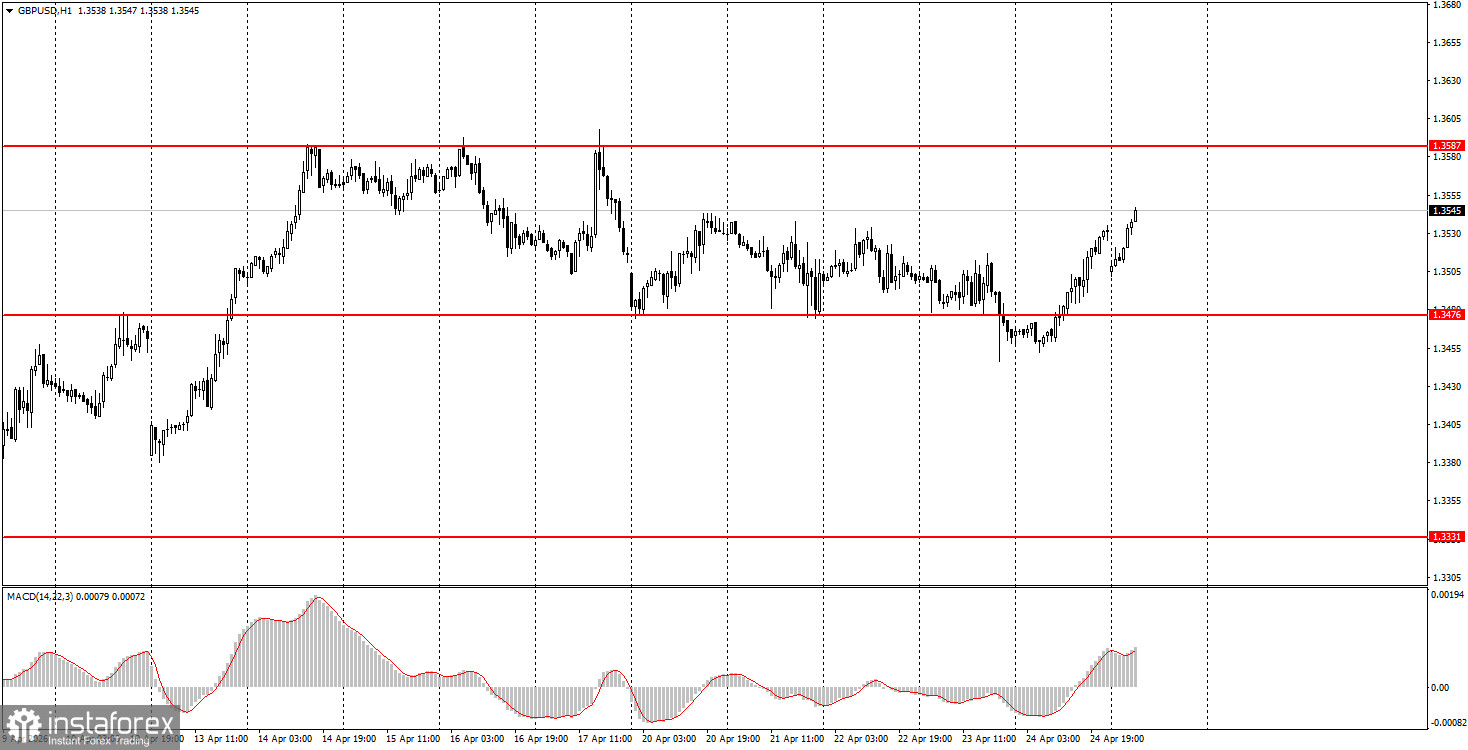
On the hourly timeframe, the GBP/USD pair continues to form an upward trend. There are still no global reasons for medium-term dollar growth, so we expect the resumption of the global upward trend of 2025 in 2026. Without a significant escalation in the Middle East, the dollar will likely be unable to sustain its growth as it has over the past two months. Individual events may still provoke its strengthening, but overall, the geopolitical factor has taken a back seat.
On Monday, beginner traders may consider opening short positions if the price bounces from the 1.3587-1.3598 area, targeting 1.3476-1.3489. If the price consolidates above the 1.3476-1.3489 area, long positions can be maintained with targets of 1.3587-1.3598.
On the 5-minute timeframe, traders can currently consider levels of 1.3175-1.3180, 1.3259-1.3267, 1.3319-1.3331, 1.3380-1.3386, 1.3476-1.3489, 1.3587-1.3598, 1.3695, and 1.3741-1.3751. No significant reports or events are scheduled for Monday in the UK or the US, so the day is expected to be dull and low in volatility.
Price levels of support and resistance are levels that serve as targets when opening buys or sells. Take Profit levels can be placed around them.
Red lines represent channels or trend lines that show the current trend and indicate the direction in which it is preferable to trade now.
The MACD indicator (14,22,3) – the histogram and the signal line – is a supporting indicator that can also be used as a source of signals.
Important speeches and reports (always included in the news calendar) can significantly affect the movement of the currency pair. Therefore, during their release, trading should be done with utmost caution, or traders should exit the market to avoid sharp price reversals against the previous movement.
Beginning traders in the forex market should remember that not every trade can be profitable. Developing a clear strategy and effective money management are the keys to long-term trading success.
Le recensioni analitiche di InstaForex ti renderanno pienamente consapevole delle tendenze del mercato! Essendo un cliente InstaForex, ti viene fornito un gran numero di servizi gratuiti per il trading efficiente.


