 Rimani
Condizioni di trading
Strumenti


The EUR/USD currency pair traded quite weakly on Tuesday due to technical factors and the complete absence of any events/news/reports. In principle, the current week begins today, on Wednesday. Today in the U.S. will be the "event of the week": the FOMC meeting, followed by meetings of the European Central Bank and the Bank of England, as well as a host of important macroeconomic reports. However, it should not be assumed that volatility will necessarily increase, and that we will see trending movements every day. All three central banks intend to keep key rates unchanged, and the macroeconomic background of any significance has been ignored by the market for two months now. Therefore, it is likely that we will see a spike in volatility by the end of the week, but not as strong as one would like, and with frequent price reversals even within the day. For the market, geopolitics remains a priority over economics or fundamentals.
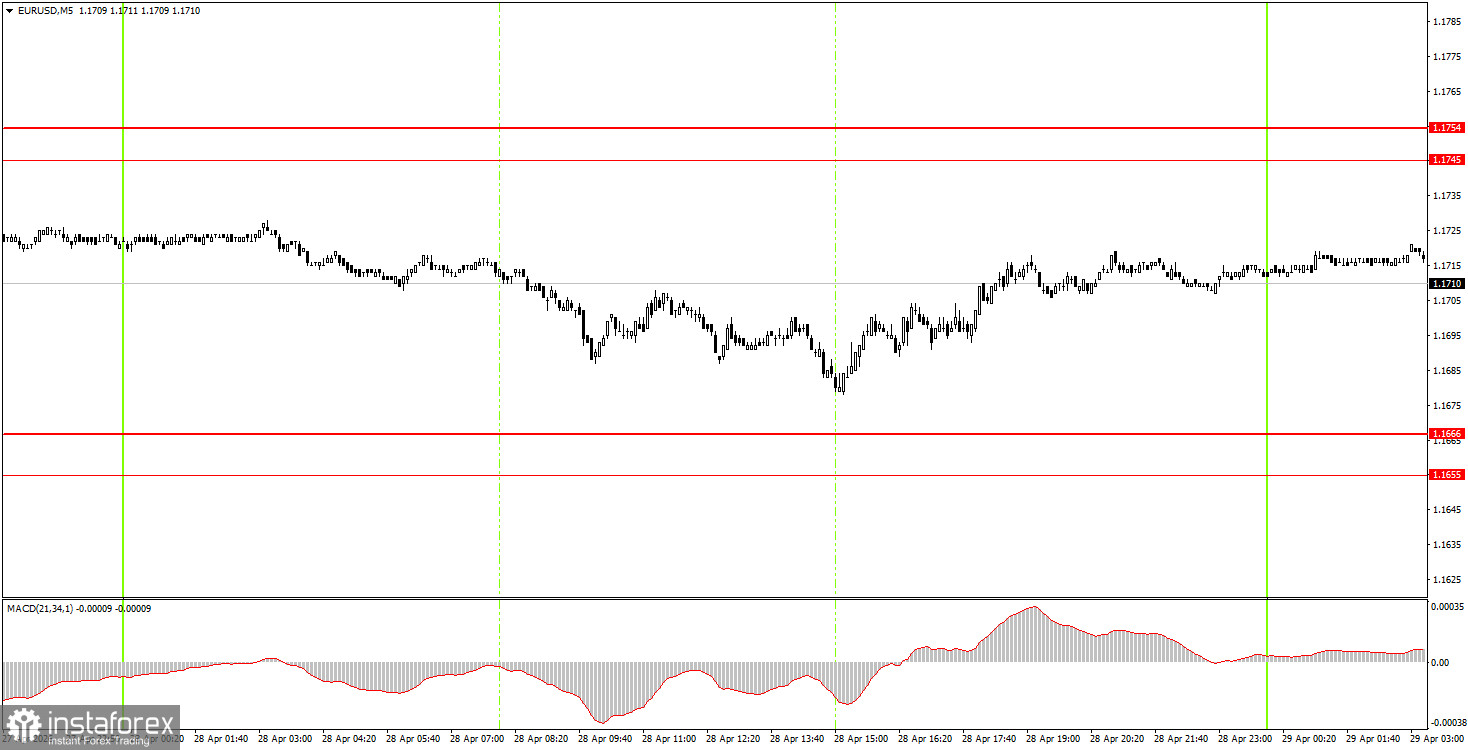
On the 5-minute timeframe on Tuesday, no trading signals were generated. Thus, throughout the day, beginner traders had no basis for opening new positions.
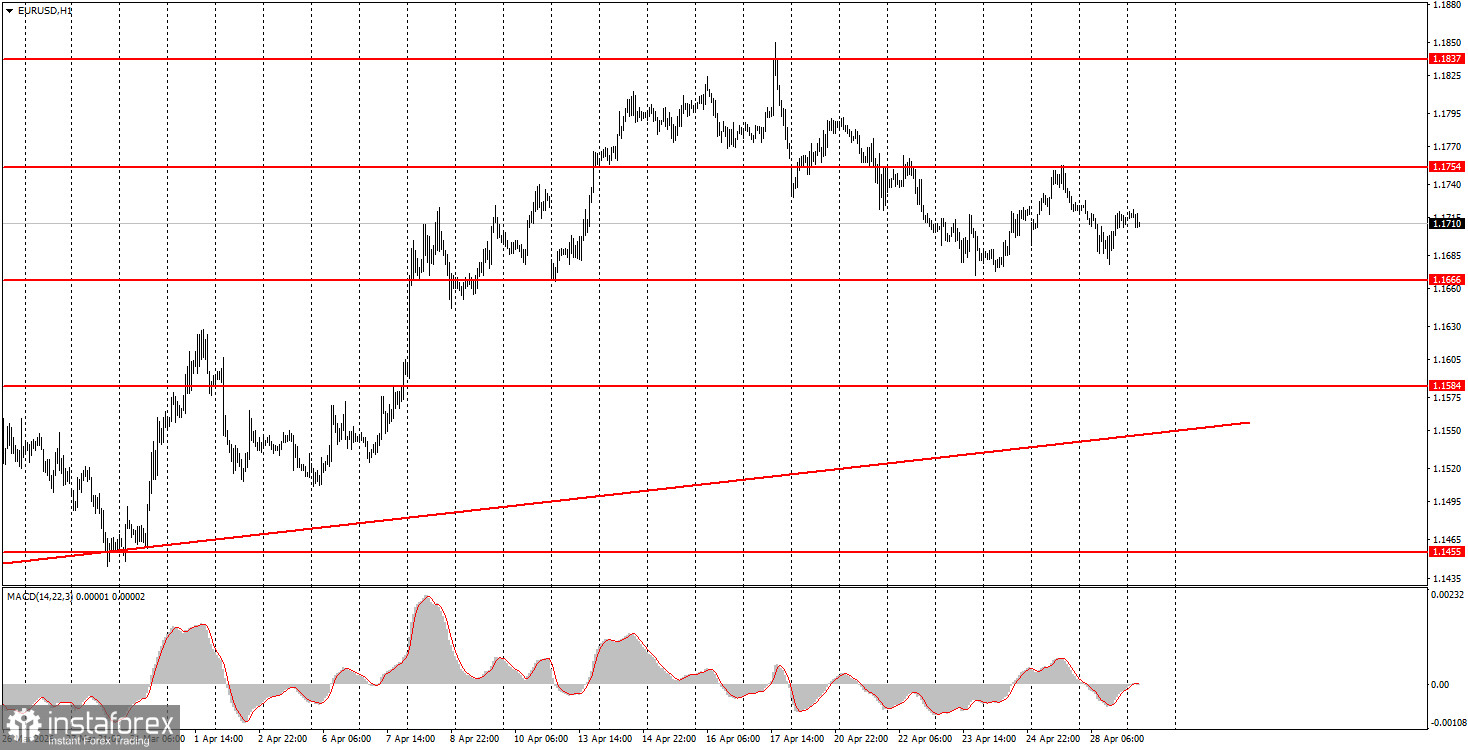
On the hourly timeframe, the upward trend remains intact. For two consecutive weeks, the market has been selling off the dollar, while geopolitics has even taken a back seat. However, the geopolitical situation is not improving, and the U.S. dollar may be in demand again as a safe asset soon. However, expecting a strong strengthening of the dollar might not be realistic now. The market has been in correction for the last week.
On Wednesday, beginner traders may open short positions targeting 1.1655-1.1666 if the price bounces off the 1.1745-1.1754 area. New long positions can be considered if the price bounces from the 1.1655-1.1666 area, targeting 1.1745-1.1754.
On the 5-minute timeframe, levels to watch are 1.1354-1.1363, 1.1413, 1.1455-1.1474, 1.1527-1.1531, 1.1584-1.1591, 1.1655-1.1666, 1.1745-1.1754, 1.1830-1.1837, 1.1899-1.1908. On Wednesday, Germany will publish an inflation report, the U.S. will release a durable goods orders report, and in the evening, the results of the FOMC meeting will be announced. Thus, we expect the main movements in the evening, and it is impossible to predict them in advance, as no one knows what rhetoric Powell will adopt.
Price levels of support and resistance are levels that serve as targets when opening buys or sells. Take Profit levels can be placed around them.
Red lines represent channels or trend lines that show the current trend and indicate the direction in which it is preferable to trade now.
The MACD indicator (14,22,3) – the histogram and the signal line – is a supporting indicator that can also be used as a source of signals.
Important speeches and reports (always included in the news calendar) can significantly affect the movement of the currency pair. Therefore, during their release, trading should be done with utmost caution, or traders should exit the market to avoid sharp price reversals against the previous movement.
Beginning traders in the forex market should remember that not every trade can be profitable. Developing a clear strategy and effective money management are the keys to long-term trading success.
Le recensioni analitiche di InstaForex ti renderanno pienamente consapevole delle tendenze del mercato! Essendo un cliente InstaForex, ti viene fornito un gran numero di servizi gratuiti per il trading efficiente.


