 Rimani
Condizioni di trading
Strumenti


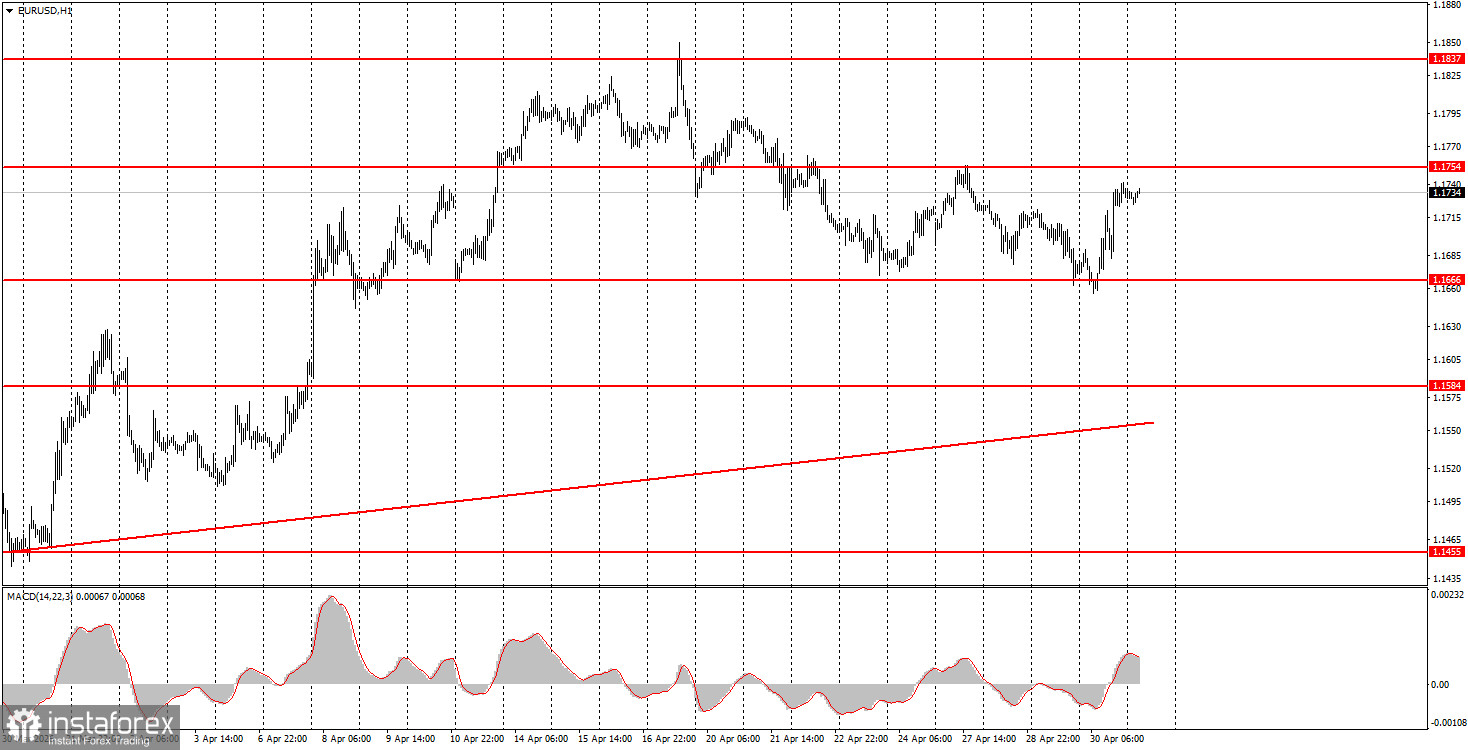
The EUR/USD currency pair showed an upward movement throughout Thursday, but on the hourly timeframe, it is clear it cannot be considered strong. The pair failed to break through the level of 1.1666, bounced back, and spent almost the entire day in a rather subdued upward trend, despite two central bank meetings and a host of important macroeconomic reports. Notably, the most significant reports on GDP from the US and the European Union, as well as on inflation in Europe, were contradictory and did not suggest a strengthening of the euro. For example, US GDP grew by 2% in the first quarter, below forecasts, while European GDP rose by only 0.1%, also below expectations. Inflation in the Eurozone increased to 3%, but the European Central Bank decided not to change interest rates and indicated that the long-term inflation trajectory would remain at 2%. In other words, inflation in Europe has risen more than expected, but the ECB does not yet see reasons for tightening monetary policy. Thus, there were no unequivocal factors supporting the upward movement yesterday. Nevertheless, the upward trend remains, and the long-term trend is upward. Therefore, the rise of the euro appears most logical.
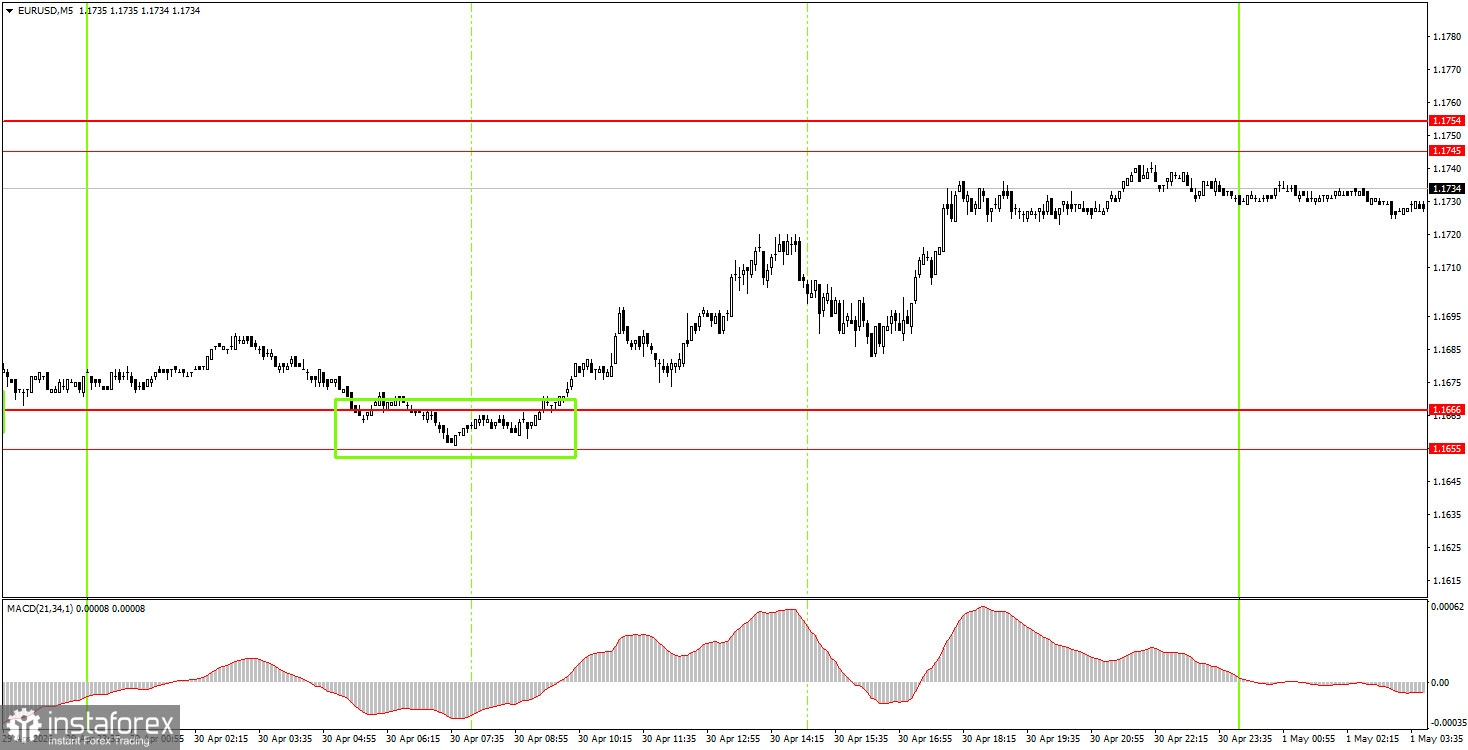
On the 5-minute timeframe, only one trading signal was formed on Thursday. During the European trading session, the price bounced from the 1.1655-1.1666 range, allowing beginner traders to open long positions. By the end of the day, the pair rose by 50 pips and almost reached the nearest target. Thus, trades could be closed in the evening with a decent profit.
On the hourly timeframe, the upward trend remains. Geopolitical conditions are not improving, and the US dollar may soon be in demand as a safe asset. However, it is probably not worth expecting a significant strengthening of the dollar at this time. At most, a correction that we have been observing for two weeks.
On Friday, beginner traders can open short positions targeting 1.1655-1.1666 if the price bounces from the 1.1745-1.1754 area. New buy trades can be considered if the price consolidates above the 1.1745-1.1754 area, with a target of 1.1830-1.1837.
On the 5-minute timeframe, levels to consider are 1.1354-1.1363, 1.1413, 1.1455-1.1474, 1.1527-1.1531, 1.1584-1.1591, 1.1655-1.1666, 1.1745-1.1754, 1.1830-1.1837, 1.1899-1.1908. On Friday, the ISM Manufacturing Index will be published in the US. This is a fairly important report, but like many others, it may be ignored. Even yesterday, when there were a huge number of significant events, the pair did not show such strong volatility.
Price levels (areas) of support and resistance – levels that are targets when opening purchases or sales, or sources of signals.
Red lines – channels or trend lines that display the current trend and indicate which direction is preferable to trade now.
MACD indicator (14, 22, 3) – histogram and signal line – a supporting indicator that can also be used as a source of signals.
Important speeches and reports (contained in the news calendar) can significantly influence the movement of the currency pair. Therefore, during their release, trading should be done as cautiously as possible, or one should exit the market to avoid a sharp price reversal against the preceding movement.
Beginners trading in the Forex market should remember that not every trade can be profitable. Developing a clear strategy and effective money management are key to long-term trading success.
Le recensioni analitiche di InstaForex ti renderanno pienamente consapevole delle tendenze del mercato! Essendo un cliente InstaForex, ti viene fornito un gran numero di servizi gratuiti per il trading efficiente.


