 Rimani
Condizioni di trading
Strumenti


The EUR/USD currency pair attempted to resume its upward trend on Friday, but geopolitical news at the end of the week triggered a new rise in the US dollar. The chances of a peaceful resolution to the conflict in the Middle East are fading by the day, which may support the American currency at times. However, in our view, the geopolitical factor will no longer provide such strong support for the dollar as it did in February or March. It is already a positive sign that the war in the Middle East is on hold, and Donald Trump has declared complete victory over his opponent. The blockade of the Strait of Hormuz remains, which will negatively impact oil and gas prices, but at the same time, the situation is not getting worse, and the world is gradually acclimatizing to the blockade. Thus, Friday's attempt to resume the upward trend was unsuccessful, but it certainly won't be the last attempt. We maintain a bullish outlook for the euro.
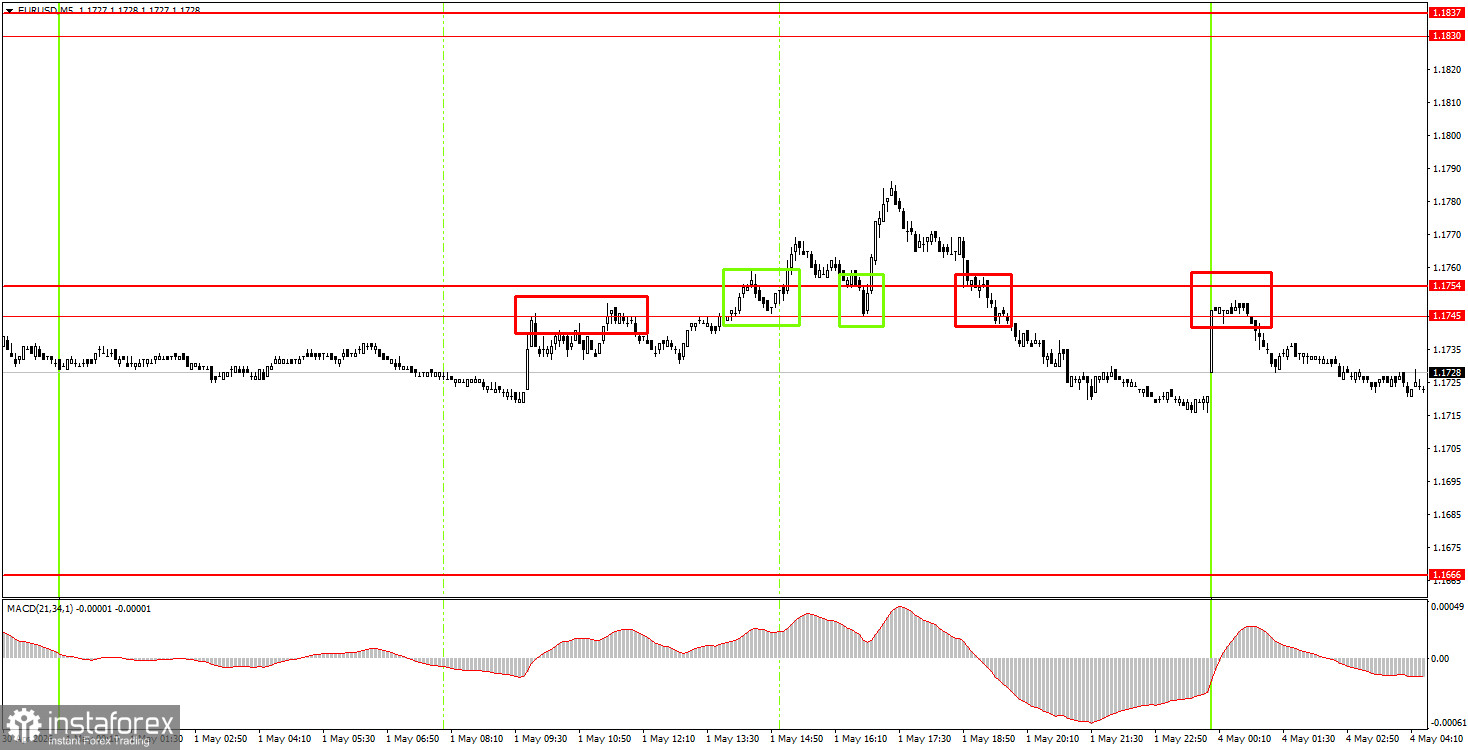
On the 5-minute timeframe, several trading signals were formed on Friday, but none allowed traders to make a profit. After the pair broke through the 1.1745-1.1754 area, an upward move was expected; however, news of Trump rejecting another Iranian peace proposal led to a reversal and a decline in the pair.
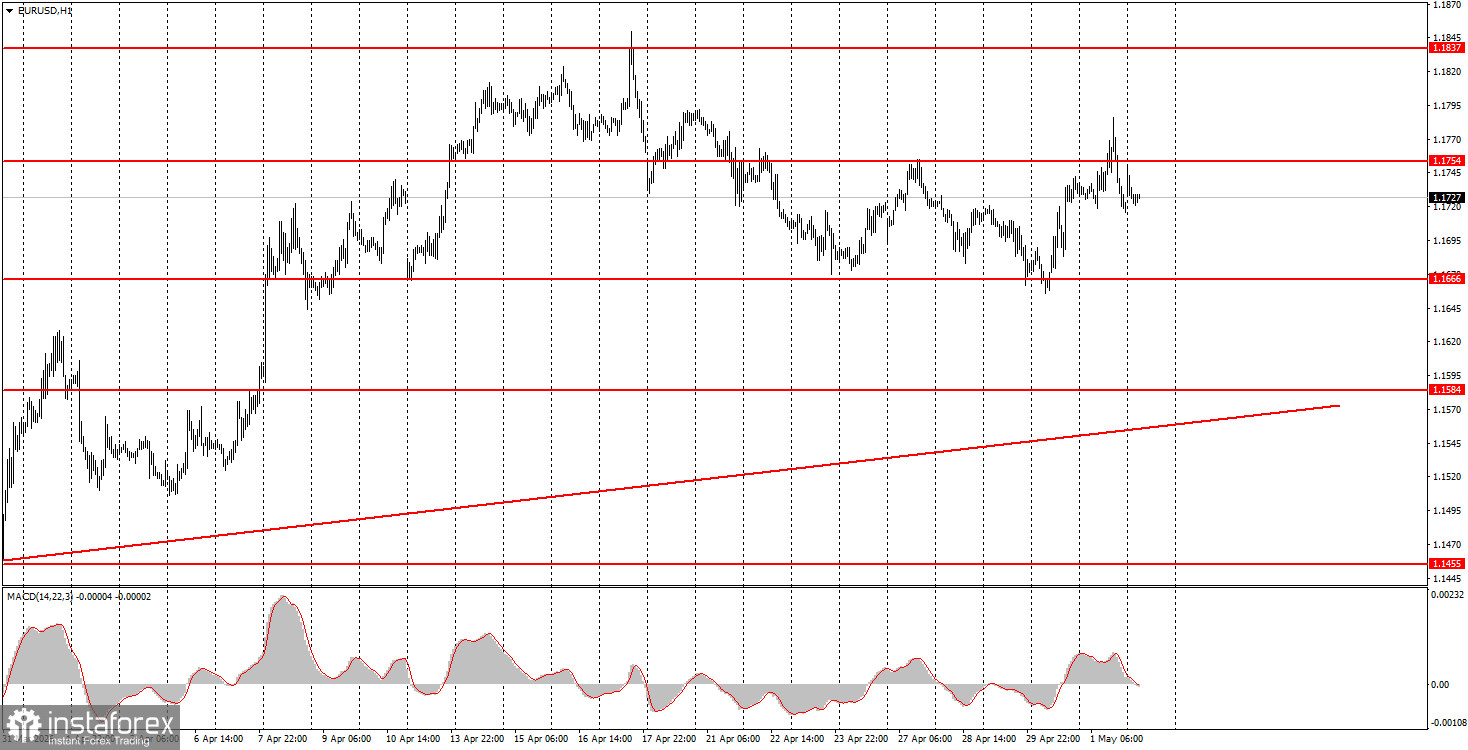
On the hourly timeframe, the upward trend remains. Geopolitical conditions are neither improving nor worsening over time. The world is gradually adjusting to the new reality in the Middle East and seeking alternative energy sources, such as the US. Therefore, it is probably not worth expecting significant strengthening of the dollar at this point. The most we can anticipate is a correction, which we have been observing for the past two weeks.
On Monday, beginner traders can open short positions targeting 1.1655-1.1666 if the price bounces from the 1.1745-1.1754 area. New long positions can be considered when the price consolidates above the 1.1745-1.1754 area, with a target of 1.1830-1.1837.
On the 5-minute timeframe, traders should consider the following levels: 1.1354-1.1363, 1.1413, 1.1455-1.1474, 1.1527-1.1531, 1.1584-1.1591, 1.1655-1.1666, 1.1745-1.1754, 1.1830-1.1837, 1.1899-1.1908. On Monday, European Central Bank President Christine Lagarde will speak, but we do not consider this an important event, as the central bank held a meeting just last week and provided all necessary information to the market.
Price levels (areas) of support and resistance – levels that are targets when opening purchases or sales, or sources of signals.
Red lines – channels or trend lines that display the current trend and indicate which direction is preferable to trade now.
MACD indicator (14, 22, 3) – histogram and signal line – a supporting indicator that can also be used as a source of signals.
Important speeches and reports (contained in the news calendar) can significantly influence the movement of the currency pair. Therefore, during their release, trading should be done as cautiously as possible, or one should exit the market to avoid a sharp price reversal against the preceding movement.
Beginners trading in the Forex market should remember that not every trade can be profitable. Developing a clear strategy and effective money management are key to long-term trading success.
Le recensioni analitiche di InstaForex ti renderanno pienamente consapevole delle tendenze del mercato! Essendo un cliente InstaForex, ti viene fornito un gran numero di servizi gratuiti per il trading efficiente.


