 Rimani
Condizioni di trading
Strumenti


The EUR/USD currency pair demonstrated very sluggish movements on Monday, despite a relatively important geopolitical backdrop that, for example, caused volatility of nearly 100 pips for the pound. However, the Euro showed little desire to trade. The day started with a rise in the dollar against the backdrop of a new violation of the ceasefire between Iran and the US over the weekend, with both sides refusing proposals to settle the conflict. Nonetheless, once again, Washington and Tehran did not conclude their negotiations and stated they would continue dialogue. Thus, while the dollar rose, it also fell back. There were no other news or updates throughout the day.
On the hourly timeframe, the upward trend persists, but the price has struggled to sustain a rise above the 1.1790 level for several consecutive days. However, the euro is pressing against this level, suggesting the upward movement will continue this week. Of course, geopolitical factors could hinder the euro's rise, as anything could happen between the US and Iran. With the negotiations at a standstill, a new escalation or ceasefire violation could temporarily push the dollar higher.
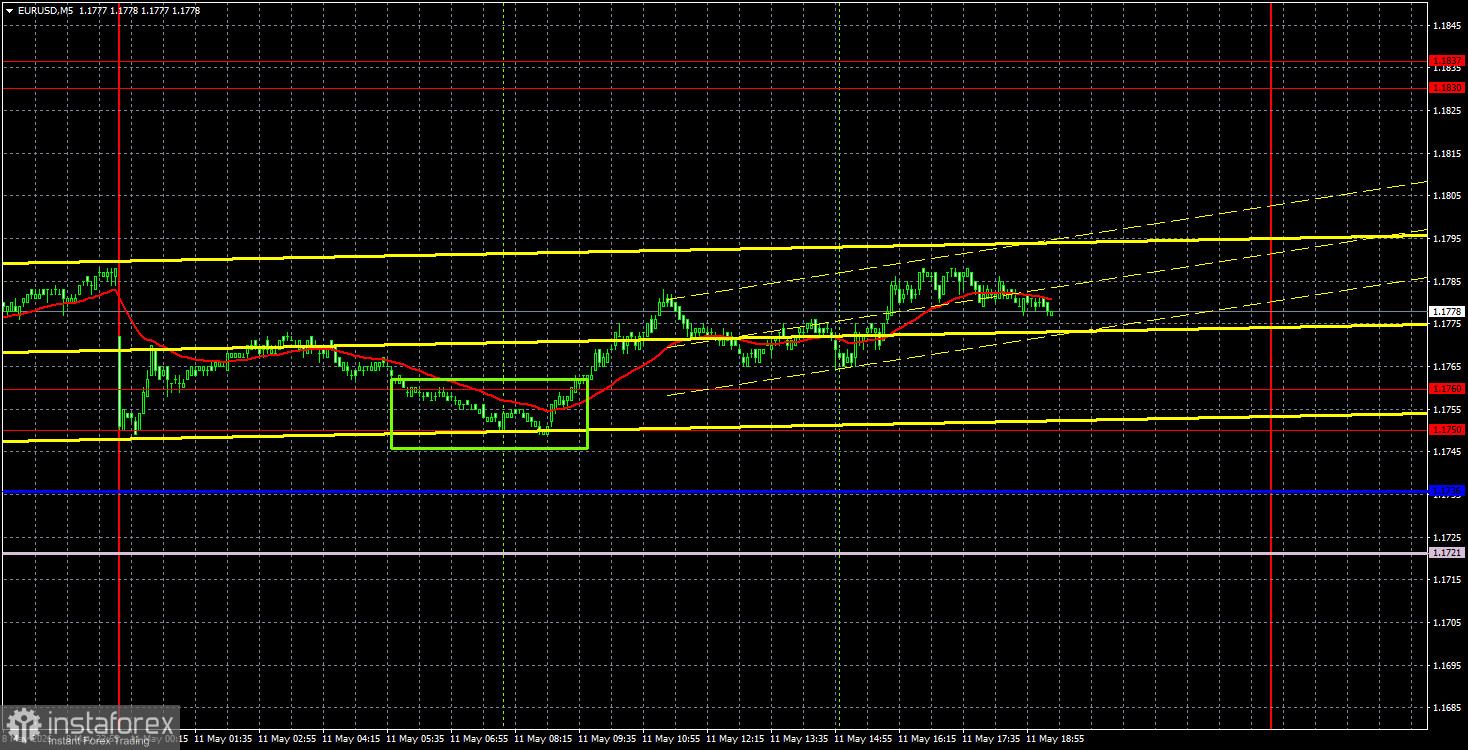
On the 5-minute timeframe, only one trading signal was formed on Monday. During the European trading session, the pair bounced off the 1.1750-1.1760 area, allowing traders to open long positions. By the end of the day, these could have been manually closed for a profit of about 15-20 pips, or carried into Tuesday.
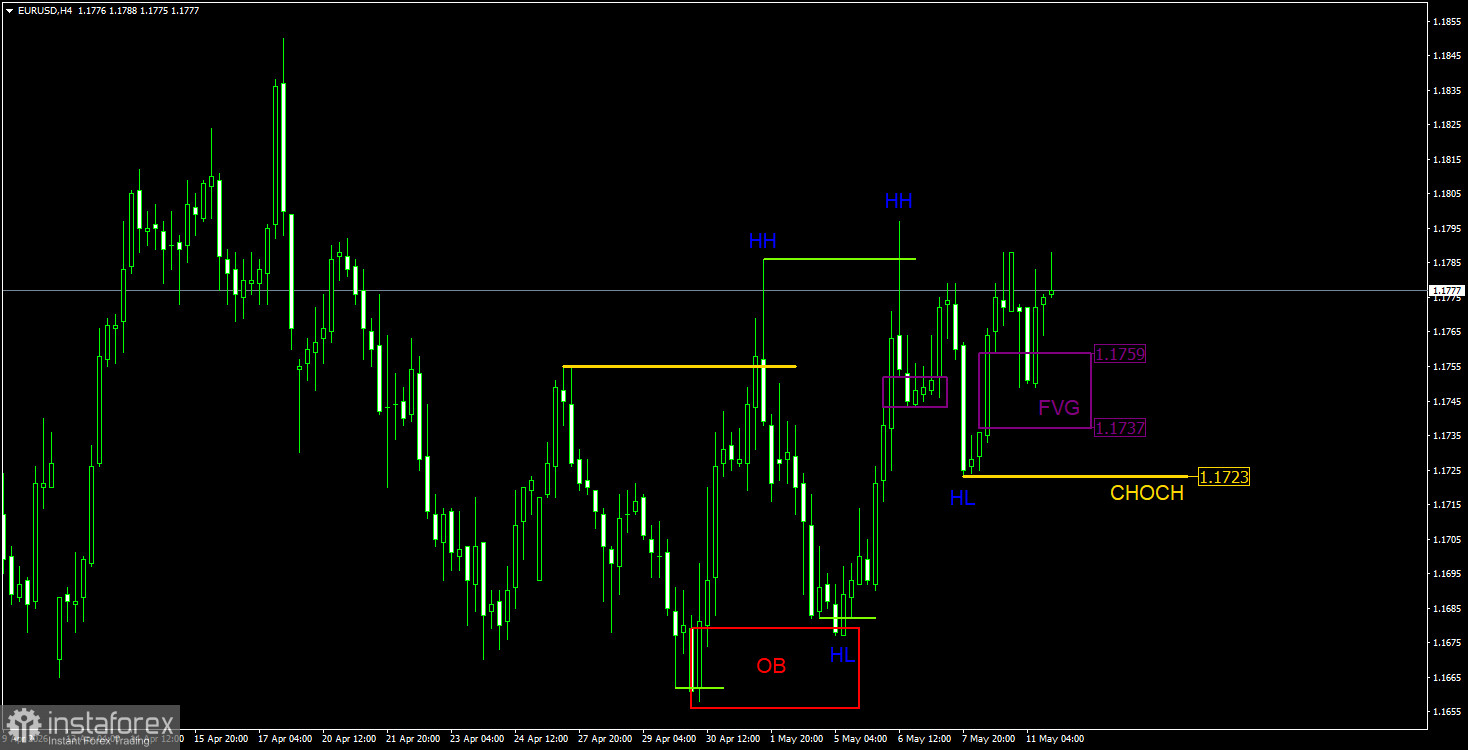
On the 4-hour timeframe, the situation according to the ICT trading system is quite clear as well. There is an upward trend, with the CHOCH line at 1.1723; only below this level can we consider the upward momentum exhausted. As long as the upward trend persists, we will focus only on bullish patterns, signals, and liquidity grabs. In the last review, we noted a bullish FVG in the 1.1737-1.1759 area. This area was indeed addressed on Monday night. The price reacted to the identified pattern, forming a buy signal that traders could have acted on. Unfortunately, volatility on the first trading day of the week was again weak, but the trade might still be held for a while longer. No new patterns were formed on Monday, and no liquidity grabs occurred. The FVG pattern could still be addressed once more.
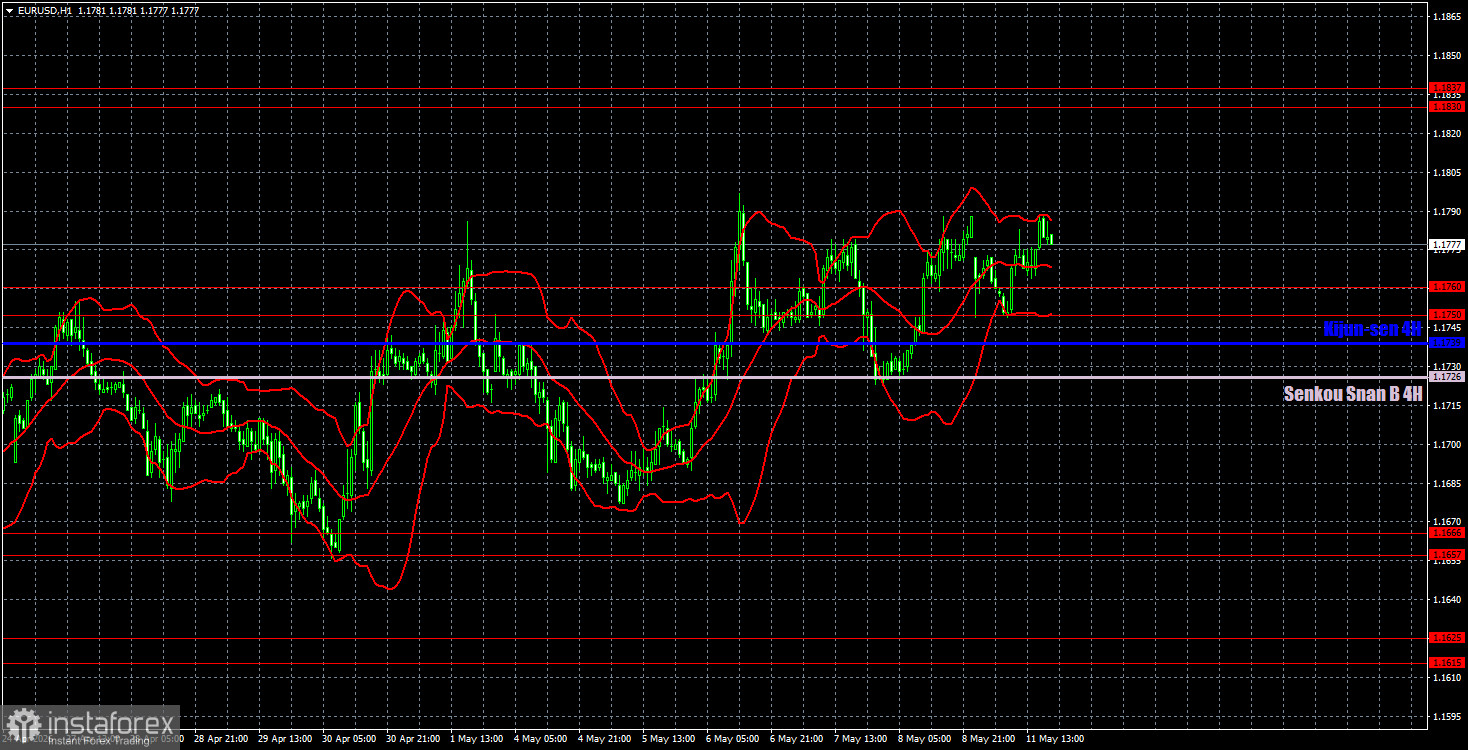
On the hourly timeframe, the EUR/USD pair continues its ascent. The situation in the Middle East remains tense but is not worsening, so there is no reason for the US dollar to further strengthen. The dollar had every chance to show growth on Friday, but once again, the market ignored important macroeconomic reports. Only geopolitical factors could impede further growth.
For May 12, we highlight the following trading levels: 1.1362, 1.1426, 1.1542, 1.1615-1.1625, 1.1657-1.1666, 1.1750-1.1760, 1.1830-1.1837, and 1.1907-1.1922, as well as the Senkou Span B line (1.1726) and Kijun-sen line (1.1739). The Ichimoku indicator lines may move during the day, which should be taken into account when determining trading signals. Remember to set a Stop Loss order to break even if the price moves 15 pips in the correct direction. This will protect against potential losses if the signal turns out to be false.
On Tuesday, the Economic Sentiment Indexes (ZEW) will be published in the EU and Germany, and the US will release an important April inflation report. We would like to say that we should expect a strong market reaction to the consumer price index, but just recall how the market reacted to the labor market and unemployment data on Friday...
Today, traders may open short positions if the price consolidates below the Senkou Span B line, targeting the 1.1657-1.1666 area. Long positions can be held after consolidation and a bounce off the 1.1750-1.1760 area, targeting 1.1830-1.1837. Longs can also be maintained after a buy signal is formed in the area of 1.1737-1.1759.
Le recensioni analitiche di InstaForex ti renderanno pienamente consapevole delle tendenze del mercato! Essendo un cliente InstaForex, ti viene fornito un gran numero di servizi gratuiti per il trading efficiente.


