 Rimani
Condizioni di trading
Strumenti



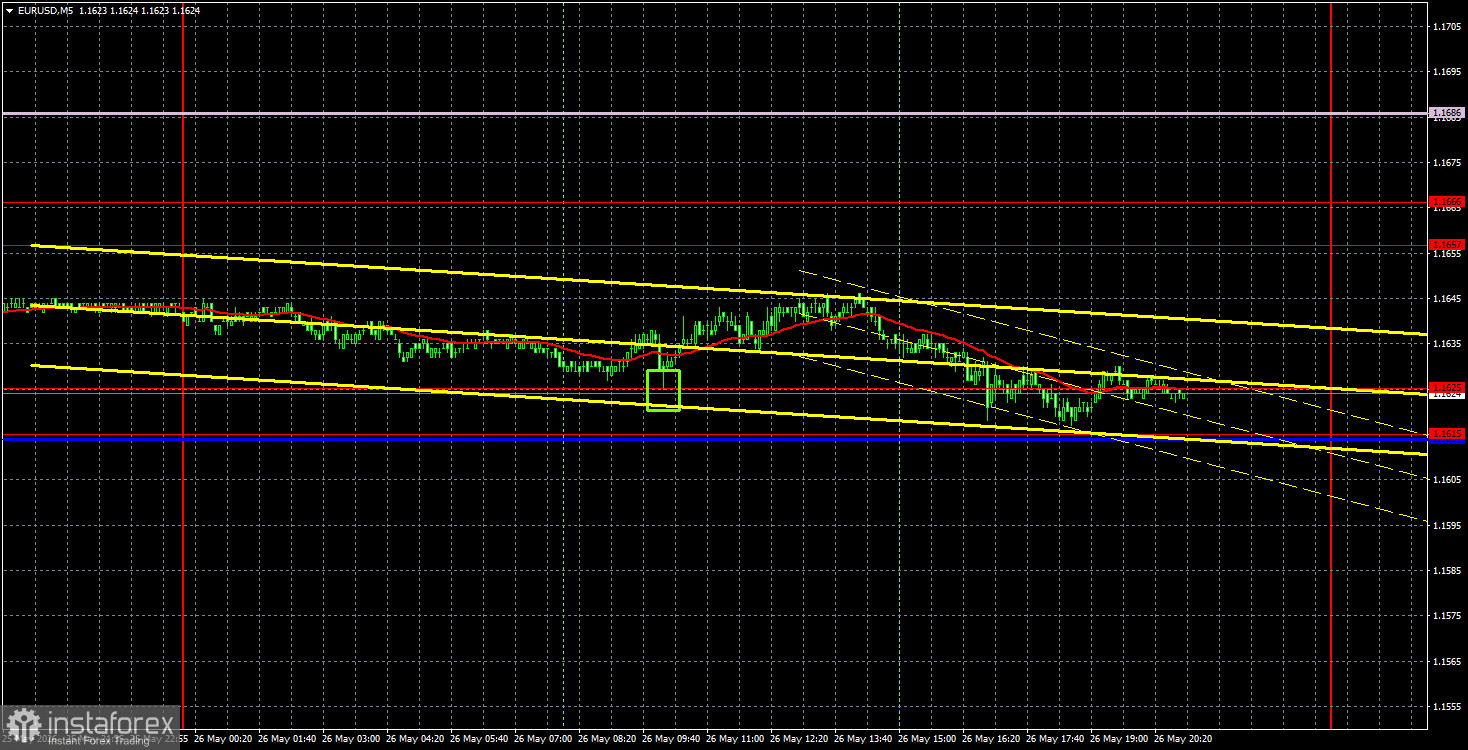
The EUR/USD currency pair began the new week with a strong upward surge, but then the market calmed down and reacted to nothing further. Over the last three trading days, volatility has dropped to low levels, which best illustrates the market's attitude toward geopolitical news. Because aside from geopolitical news, traders have no other information at their disposal. Yesterday, it became known that Washington launched a missile strike in southern Iran, destroying several boats that were allegedly involved in mining the Strait of Hormuz. Tehran has already promised not to ignore this new act of aggression and has questioned the prospects for further negotiations with Washington. Thus, the ceasefire once again hangs by a thread, which could have provided strong support for the dollar on Tuesday. However, it did not. The EUR/USD currency pair has been virtually stagnant for several consecutive days.
From a technical standpoint, the downward trend persists. The price is below the Senkou Span B line, and a trendline is still not possible to establish. Thus, we will consider the downward trend complete only after the Senkou Span B line is overcome. Without the signing of the memorandum, it will be difficult for the euro to rise above this line.
In the 5-minute timeframe on Tuesday, one buy signal was generated. During the European trading session, the price rebounded from the level of 1.1625 and managed to rise 10 pips at best during the day. There are currently no movements in the market, so it does not matter what signals are being formed.
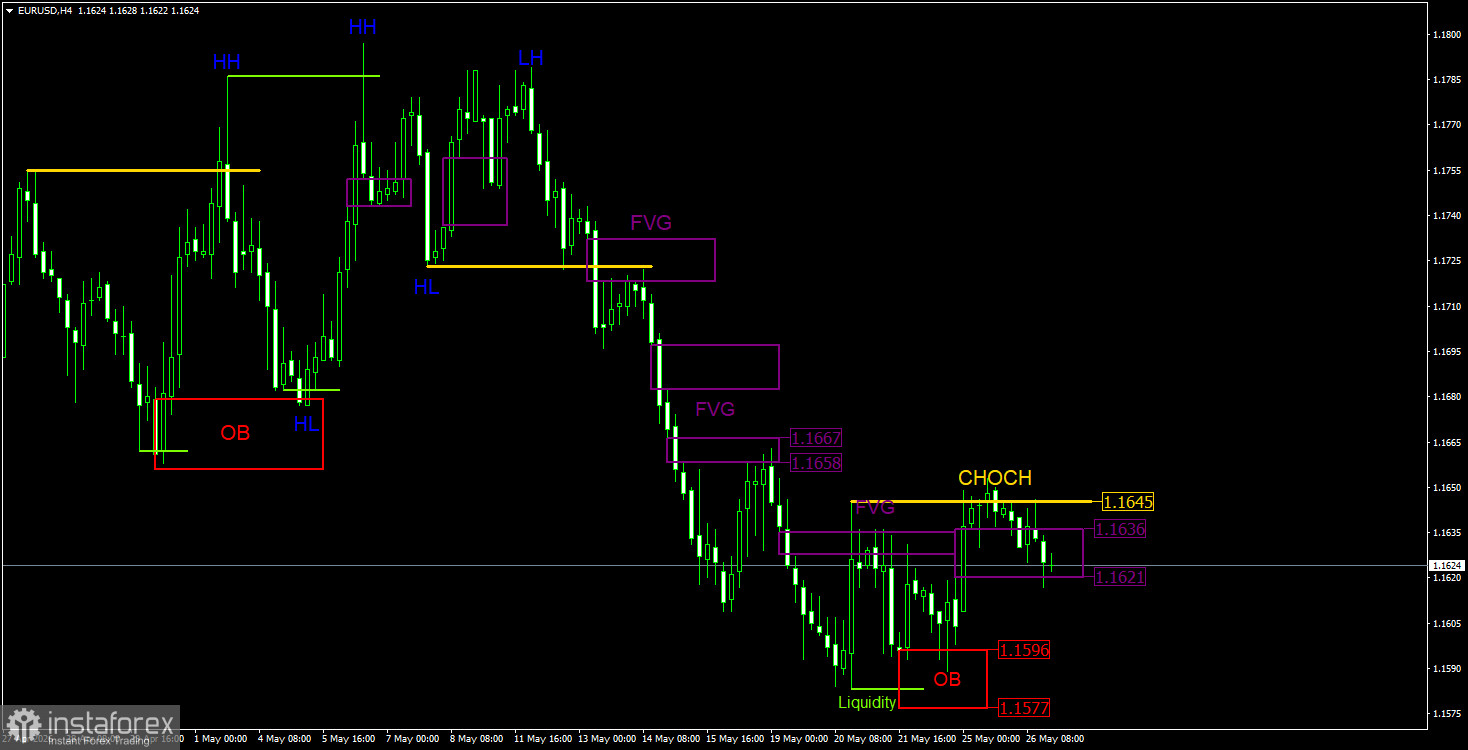
On the 4-hour timeframe within the ICT trading system, the price formed a buy signal in a "bullish" order block last week, and on Monday, it formed a new bullish FVG, which received an initial reaction. However, on Tuesday, the geopolitical situation sharply worsened again, and the signing of the memorandum that Trump has been speaking about every hour and a half is once again on the verge of collapse. Therefore, the pair's decline on Tuesday is not surprising. The price may receive a second reaction to the imbalance at 1.1621-1.1636, but for the euro to grow, geopolitics needs to improve, not worsen.
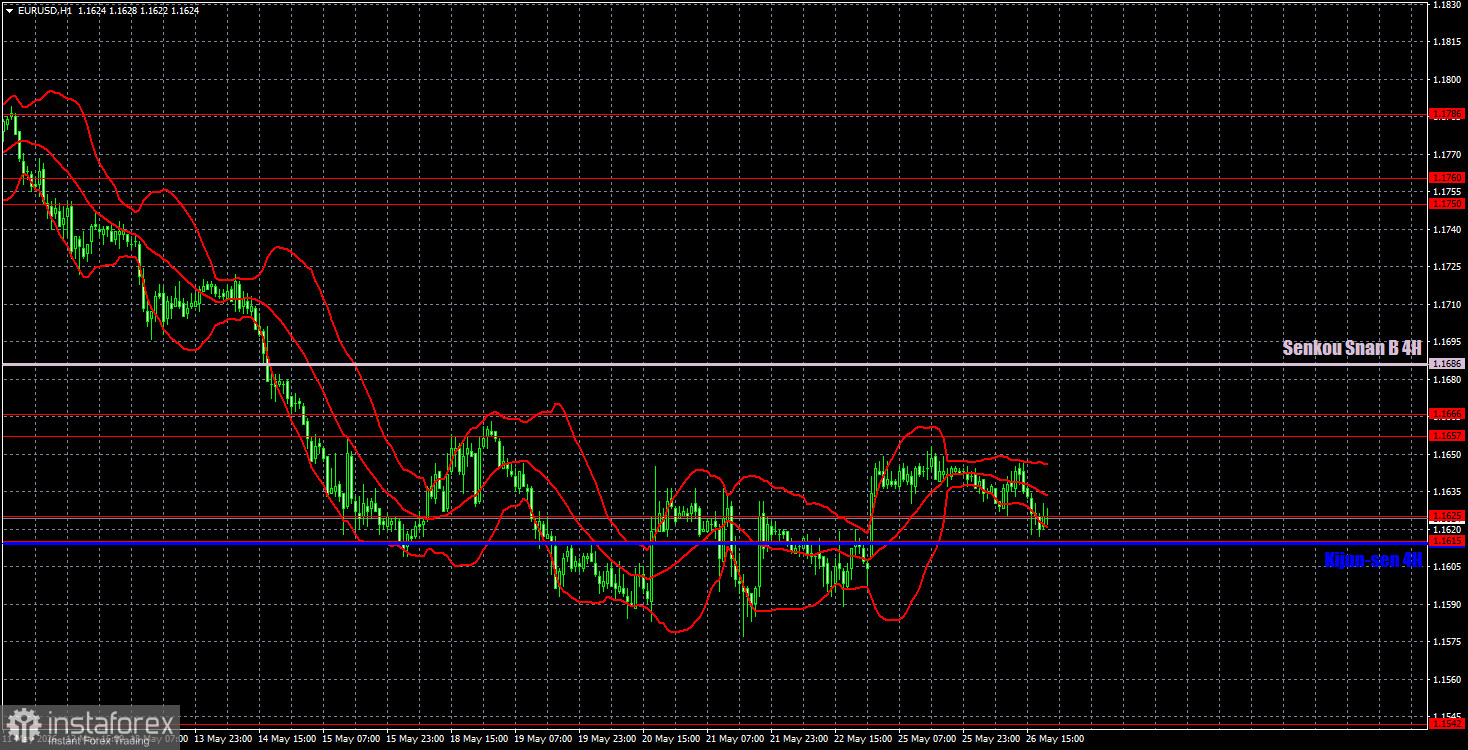
On the hourly timeframe, the EUR/USD pair continues to form a downward trend. The situation in the Middle East remains tense, with no signs of improvement, and Washington and Tehran may sign a preliminary agreement. If no new signs of escalation appear in the Middle East and the memorandum is indeed signed, the dollar will begin to lose ground. However, we are currently observing the opposite situation.
For May 27, we highlight the following levels for trading: 1.1362, 1.1426, 1.1542, 1.1615-1.1625, 1.1657-1.1666, 1.1750-1.1760, 1.1786, 1.1830-1.1837, 1.1907-1.1922, as well as the Senkou Span B line (1.1686) and Kijun-sen (1.1614). The Ichimoku indicator lines may move throughout the day, which should be taken into account when determining trading signals. Don't forget to set your Stop Loss orders to breakeven if the price moves in the correct direction by 15 pips. This will protect against potential losses if the signal turns out to be false.
On Wednesday, there are again no significant events or reports planned in the EU or the U.S., and the market will await developments in the Middle East, particularly Iran's response to the U.S. attack on Tuesday. If there are no news updates, we can expect another dull day with minimal price movements.
Today, traders may open short positions targeting 1.1542 if the price consolidates below the 1.1615-1.1625 area. Long positions can be opened if the price bounces from the 1.1615-1.1625 area, targeting the 1.1657-1.1666 area and the Senkou Span B line. On the 4-hour timeframe, long positions are relevant if a buy signal forms in the latest bullish FVG.
Le recensioni analitiche di InstaForex ti renderanno pienamente consapevole delle tendenze del mercato! Essendo un cliente InstaForex, ti viene fornito un gran numero di servizi gratuiti per il trading efficiente.


