 Rimani
Condizioni di trading
Strumenti


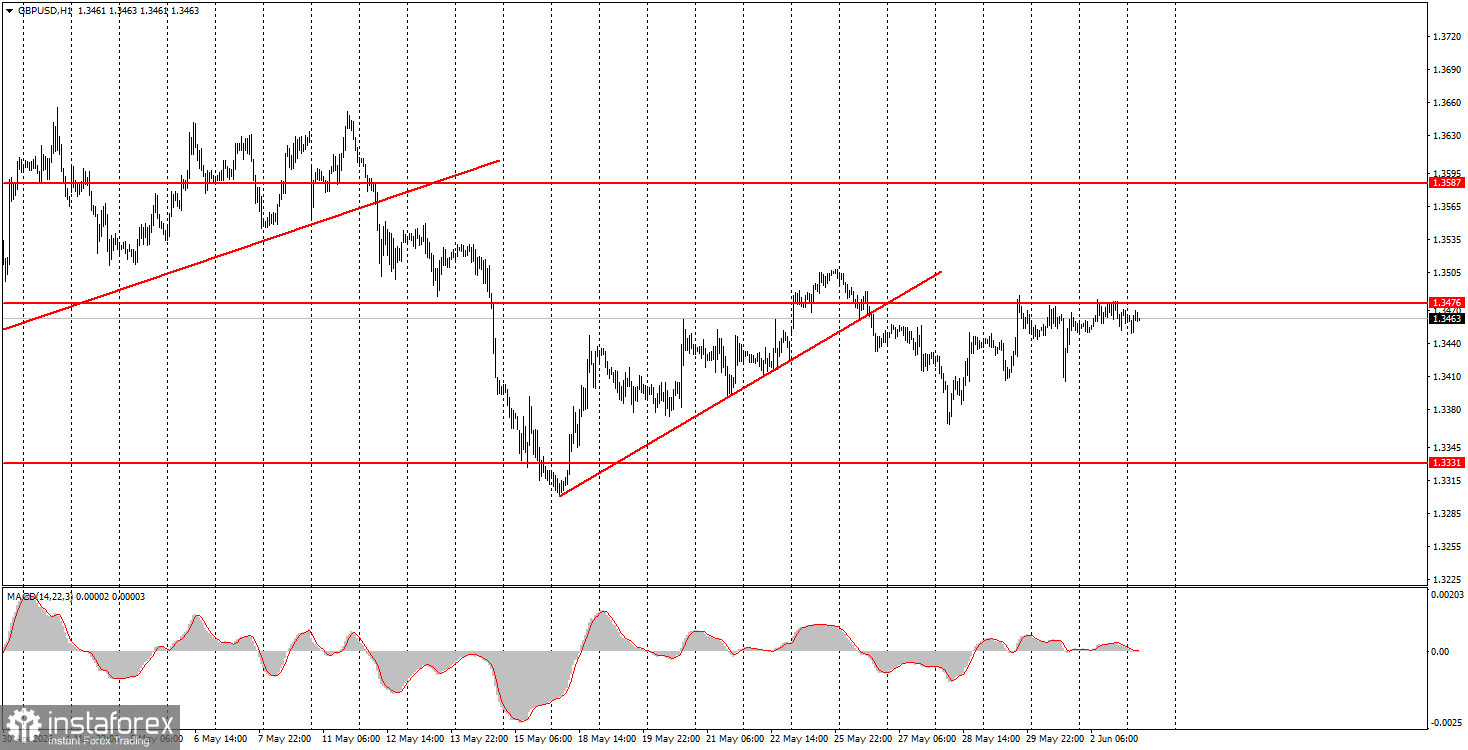
The GBP/USD pair did not trade at all on Tuesday. While the euro dropped 20 pips by the end of the day, the pound couldn't even manage that. The pair spent the entire day within the range of 1.3456-1.3476. In other words, the day's volatility did not exceed 30 pips. In the EUR/USD article, we mentioned that, in theory, the market's reaction to some events could be present, but it is not visible on the charts and has no impact. The British pound dispels these doubts—there is simply no reaction to either geopolitical or macroeconomic events. Formally, a new downward trend continues after breaching the ascending trend line, but the price is not falling. Perhaps the upward trend is taking on a more complex structure and remains intact, but the pound cannot hold above 1.3476. It's an absolutely stalemate situation. We should expect some resolution and at least some movement.
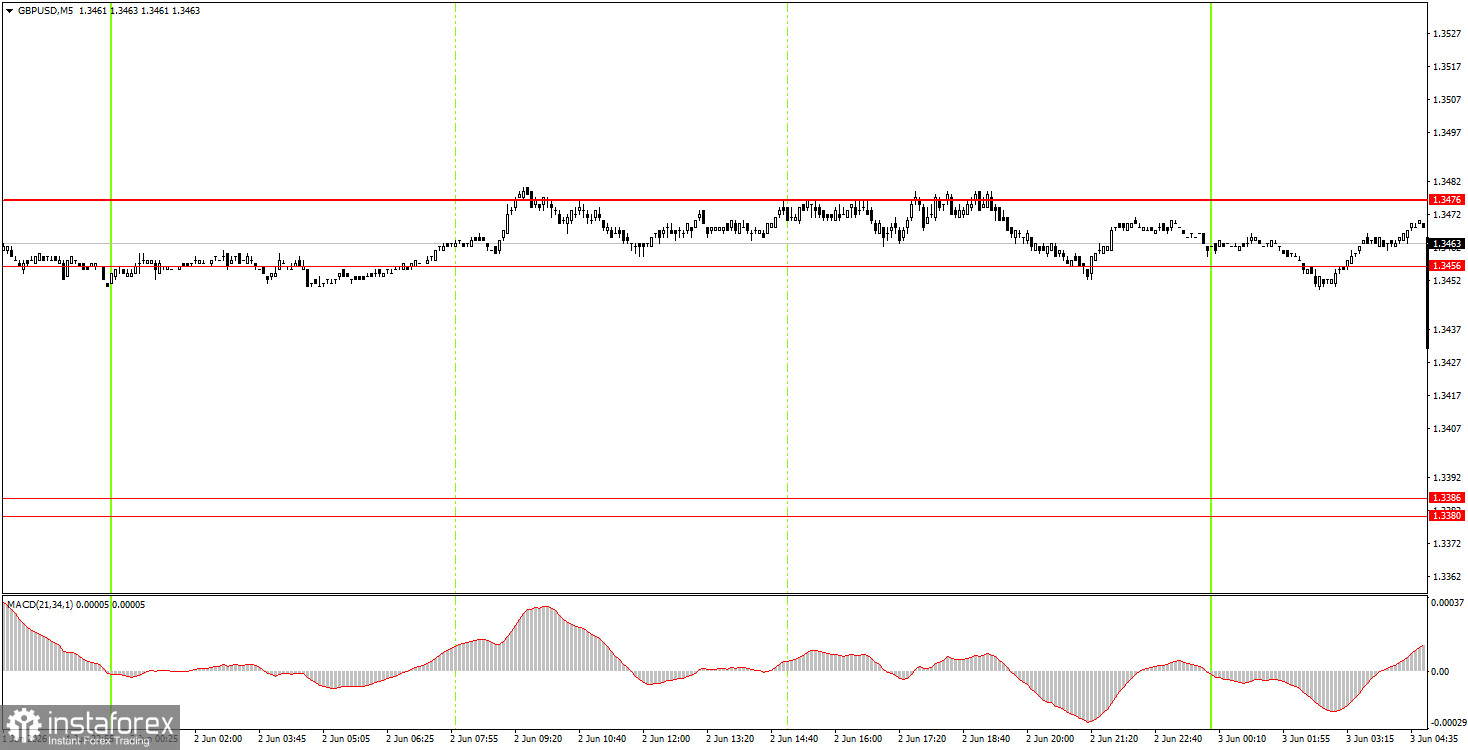
On the 5-minute timeframe on Tuesday, no trading signals were generated, as the price remained within the area intended to generate these signals throughout the day. However, the movements during the day were absent, so there was no basis for novice traders to enter the market.
On the hourly timeframe, the GBP/USD pair continues to form a downward trend, as geopolitical tensions are worsening again, and the trend line has been breached. However, without resuming full-scale war in the Middle East, the dollar cannot expect to rise as it did in February-March. Separate events may still provoke their strengthening, but we do not believe that the market will initiate a new wave of risk aversion.
On Wednesday, novice traders can open short positions targeting 1.3380-1.3386 if the price consolidates below the 1.3456-1.3476 area. If the price consolidates above the 1.3456-1.3476 area, long positions can be opened with targets of 1.3587-1.3598. However, be mindful of the low volatility.
On the 5-minute timeframe, consider the following levels: 1.3175-1.3180, 1.3259-1.3267, 1.3319-1.3331, 1.3380-1.3386, 1.3456-1.3476, 1.3587-1.3598, 1.3631-1.3641, 1.3695, and 1.3741-1.3751. The calendar still shows a lack of significant events for Wednesday in the UK, while the US will release the ISM and ADP reports, which are quite important, but which the market may completely ignore.
Price levels (areas) of support and resistance are targets when opening long or short positions or sources of signals.
Red lines indicate channels or trend lines that display the current trend and indicate the preferred direction for trading.
The MACD indicator (14,22,3) – histogram and signal line – is a supplementary indicator that can also be used as a source of signals.
Important speeches and reports (contained in the news calendar) can significantly impact the movement of the currency pair. Therefore, during their release, trading should be conducted with maximum caution, or one should exit the market to avoid sharp reversals against preceding movements.
Beginners trading in the forex market should remember that not every trade can be profitable. Developing a clear strategy and practicing money management are keys to success in trading over the long term.
Le recensioni analitiche di InstaForex ti renderanno pienamente consapevole delle tendenze del mercato! Essendo un cliente InstaForex, ti viene fornito un gran numero di servizi gratuiti per il trading efficiente.


