 Rimani
Condizioni di trading
Strumenti


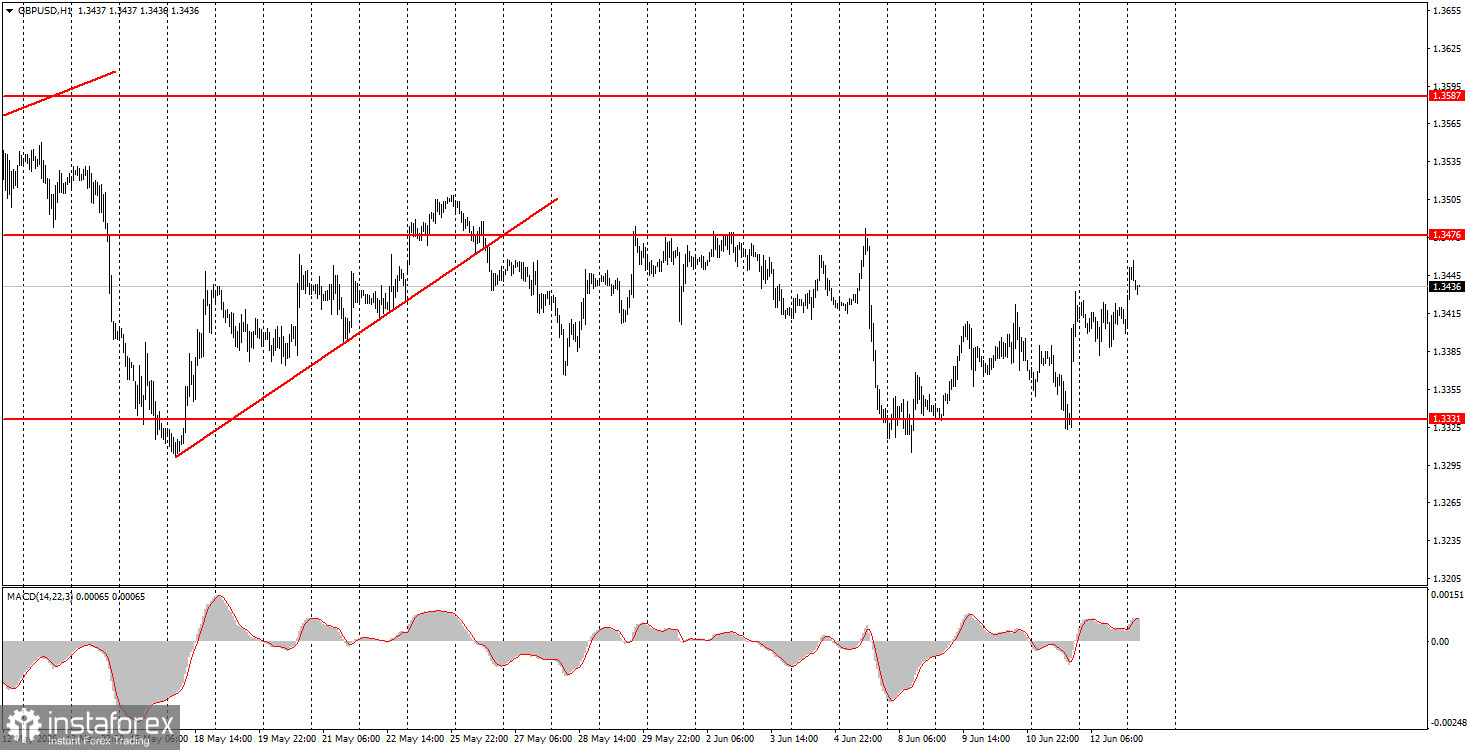
The GBP/USD pair also traded on Friday without any desire and showed a volatility of just 42 pips. It is evident that traders on this day did not react to world events. Two reports were published in the UK, which we initially labeled as secondary and did not expect to prompt a market reaction. In the US, the University of Michigan consumer sentiment index was released, but it also had no impact on the market. After a fairly active Thursday, the market froze again and, overall, has been trading in a sideways channel for more than a month, as is clearly visible on the hourly timeframe. The market's lack of urgency is understandable. Donald Trump promised a deal with Iran and the opening of the Strait of Hormuz for the 29th time, but since the previous 28 times ended with nothing, the market is waiting to see what will happen in the Middle East this time. If the deal is indeed signed this week, demand for the US currency will continue to decrease, as the market will no longer need a safe-haven asset. And in 2026, the dollar will have been supported only by this factor.
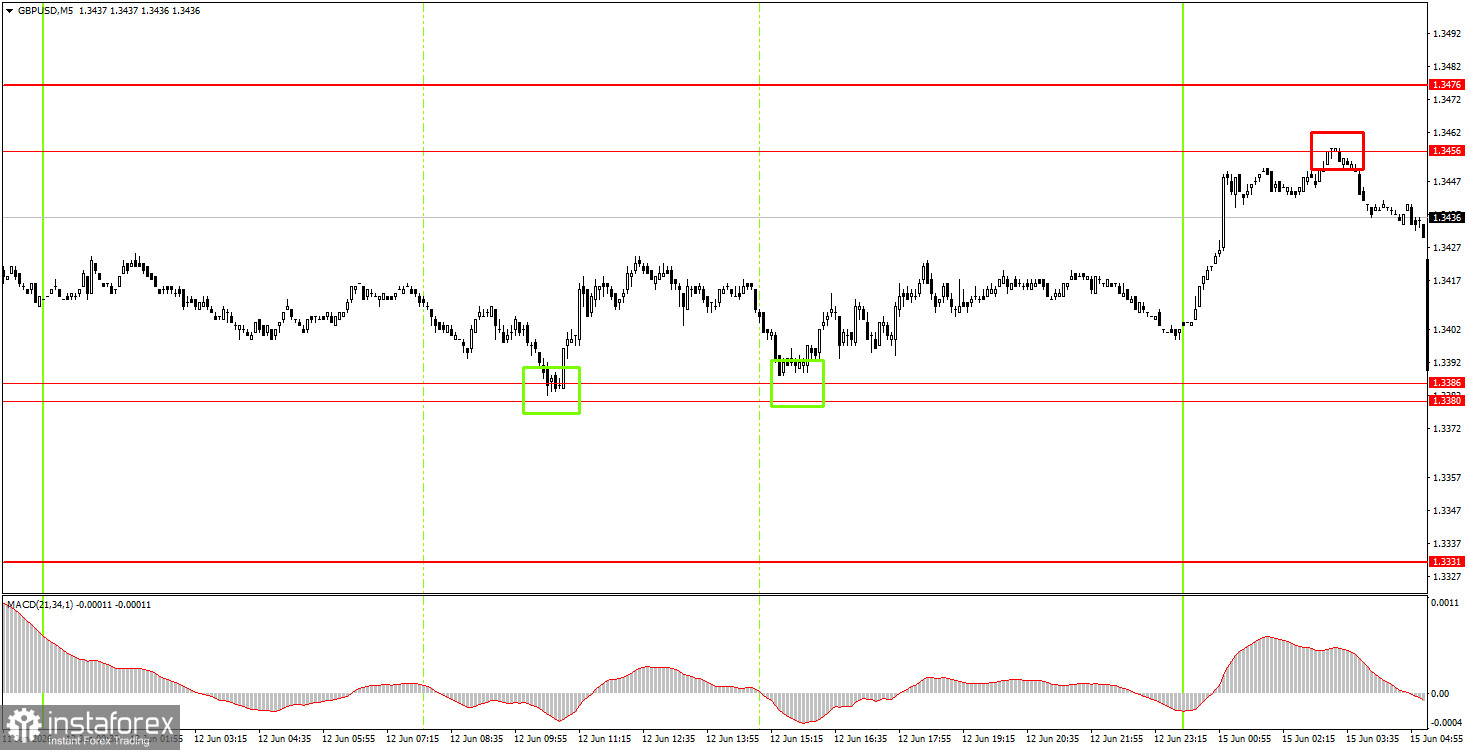
On the 5-minute timeframe, two buy signals were formed on Friday, allowing traders to open two long positions. In both cases, the price moved in the right direction by 25-30 pips. Last night, we saw another rise following Trump's statements, but a sell signal formed in the form of a bounce from the 1.3456-1.3476 area.
On the hourly timeframe, the GBP/USD pair has effectively been trading in a flat for almost a month, as the geopolitical situation remains consistently poor but does not get any worse or better. Without a resumption of full-scale war in the Middle East, the dollar cannot expect the growth it saw in February and March. If the war ends, the dollar will lose its key support factor.
On Monday, novice traders may open new short positions targeting 1.3380-1.3386 on a bounce from the 1.3456-1.3476 area. If the price consolidates above the 1.3456-1.3476 area, long positions can be opened with targets of 1.3587-1.3598.
On the 5-minute timeframe, current levels to trade are 1.3175-1.3180, 1.3259-1.3267, 1.3319-1.3331, 1.3380-1.3386, 1.3456-1.3476, 1.3587-1.3598, 1.3631-1.3641, 1.3695, and 1.3741-1.3751. On Monday, there are no important events or reports scheduled in the UK, while in the US, a report on industrial production will be released, which is unlikely to interest the market. Today, geopolitical factors will again take precedence.
Price levels (areas) of support and resistance are targets when opening long or short positions or sources of signals.
Red lines indicate channels or trend lines that display the current trend and indicate the preferred direction for trading.
The MACD indicator (14,22,3) – histogram and signal line – is a supplementary indicator that can also be used as a source of signals.
Important speeches and reports (contained in the news calendar) can significantly impact the movement of the currency pair. Therefore, during their release, trading should be conducted with maximum caution, or one should exit the market to avoid sharp reversals against preceding movements.
Beginners trading in the forex market should remember that not every trade can be profitable. Developing a clear strategy and practicing money management are key to long-term success in trading.
Le recensioni analitiche di InstaForex ti renderanno pienamente consapevole delle tendenze del mercato! Essendo un cliente InstaForex, ti viene fornito un gran numero di servizi gratuiti per il trading efficiente.


