 Rimani
Condizioni di trading
Strumenti


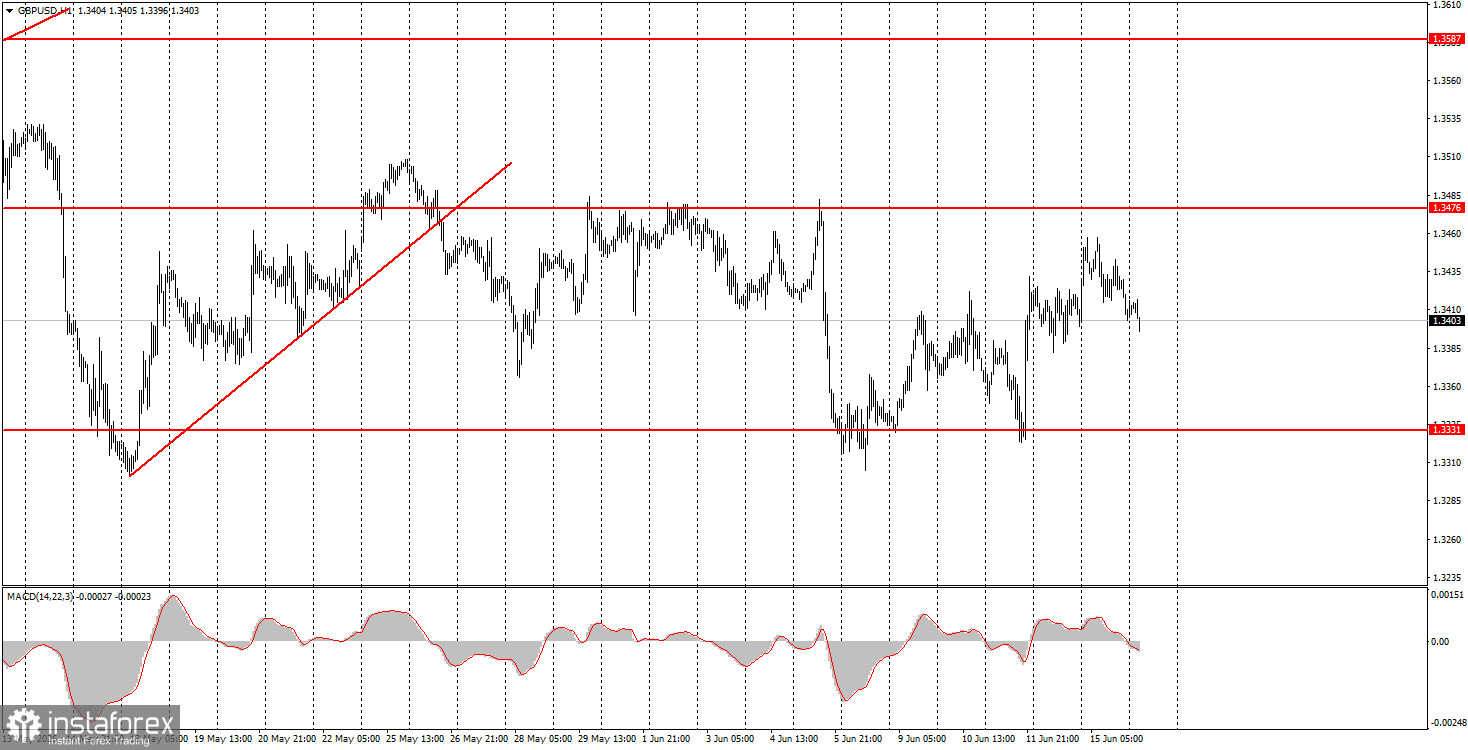
The GBP/USD pair also failed to show the movements that many traders were hoping for on Monday. At the market open, the dollar declined sharply, but throughout the day, it returned to its starting level, and the hourly timeframe clearly shows it has been in a flat range for over a month. Thus, there are currently no compelling reasons for the dollar to rise, while risk currencies like the British pound have a higher chance of strengthening. However, overall, we have seen sideways movement for more than a month. This week, meetings of the Bank of England and the Federal Reserve are scheduled, and as the conflict in the Middle East approaches its end, the market may shift its focus from geopolitics to the economy. Neither central bank intends to raise or lower its key rates in June; however, their heads may make important statements, and, as a bonus, the UK will release an inflation report the day before the central bank's meeting. Therefore, the week could turn out to be volatile, but will it be enough to end the pound's flat movement?
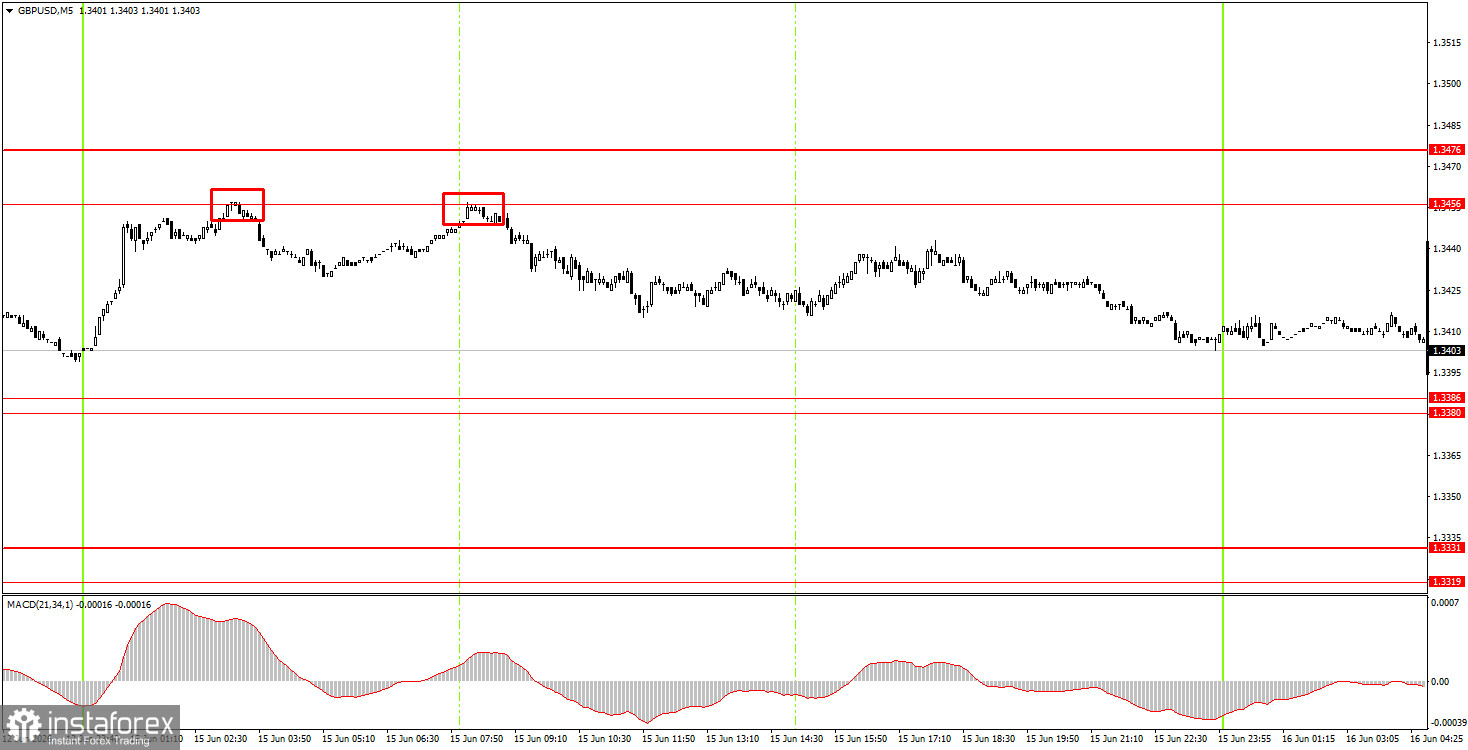
On the 5-minute timeframe, two sell signals were formed on Monday. The price bounced twice from the 1.3456-1.3476 area, giving novice traders the opportunity to open at least one short position at the start of the European session. By the end of the day, the pair dropped by 25-30 pips, which traders could take as profit.
On the hourly timeframe, the GBP/USD pair has been trading in a flat range for the second consecutive month, as geopolitical tensions remain tense and not very optimistic. Without the resumption of a full-scale war in the Middle East, the dollar cannot be expected to rise as it did in February and March. If the war ends, the dollar will lose its key support factor.
On Tuesday, novice traders may open new short positions targeting 1.3319-1.3331 if the price settles below the 1.3380-1.3386 area. A bounce in the 1.3380-1.3386 area will allow long positions to be opened with targets of 1.3456-1.3476.
On the 5-minute timeframe, the following levels are currently available for trading: 1.3175-1.3180, 1.3259-1.3267, 1.3319-1.3331, 1.3380-1.3386, 1.3456-1.3476, 1.3587-1.3598, 1.3631-1.3641, 1.3695, and 1.3741-1.3751. There are no important events or reports scheduled for Tuesday in the UK, while reports on building permits and new housing construction will be released in the US. These data are unlikely to attract the market's attention.
Price levels (areas) of support and resistance are targets when opening long or short positions or sources of signals.
Red lines indicate channels or trend lines that display the current trend and indicate the preferred direction for trading.
The MACD indicator (14,22,3) – histogram and signal line – is a supplementary indicator that can also be used as a source of signals.
Important speeches and reports (contained in the news calendar) can significantly impact the movement of the currency pair. Therefore, during their release, trading should be conducted with maximum caution, or one should exit the market to avoid sharp reversals against preceding movements.
Beginners trading in the forex market should remember that not every trade can be profitable. Developing a clear strategy and practicing money management are key to long-term success in trading.
Le recensioni analitiche di InstaForex ti renderanno pienamente consapevole delle tendenze del mercato! Essendo un cliente InstaForex, ti viene fornito un gran numero di servizi gratuiti per il trading efficiente.


