 Rimani
Condizioni di trading
Strumenti


On Thursday, the EUR/USD currency pair began a weak upward correction that only weakly resembles an actual correction. The technical picture now looks more like a temporary pause before a new decline. The euro cannot recover under any circumstances, as the market continues to move in an illogical way and simply ignores most macroeconomic and fundamental events. The culmination was yesterday's report on U.S. GDP for the first quarter, which exceeded forecasts, but... prompted a decline in the U.S. dollar. Thus, we are once again convinced that there is no correlation between news and the pair's movements at the moment. It is worth remembering that two weeks ago, the European Central Bank carried out a monetary policy tightening, which the market did not react to at all. Then we saw weekly growth in the dollar based solely on expectations from Federal Reserve representatives for a rate hike by the end of the year. The factor of the conclusion of the geopolitical conflict in the Middle East was also not taken into account by the market.
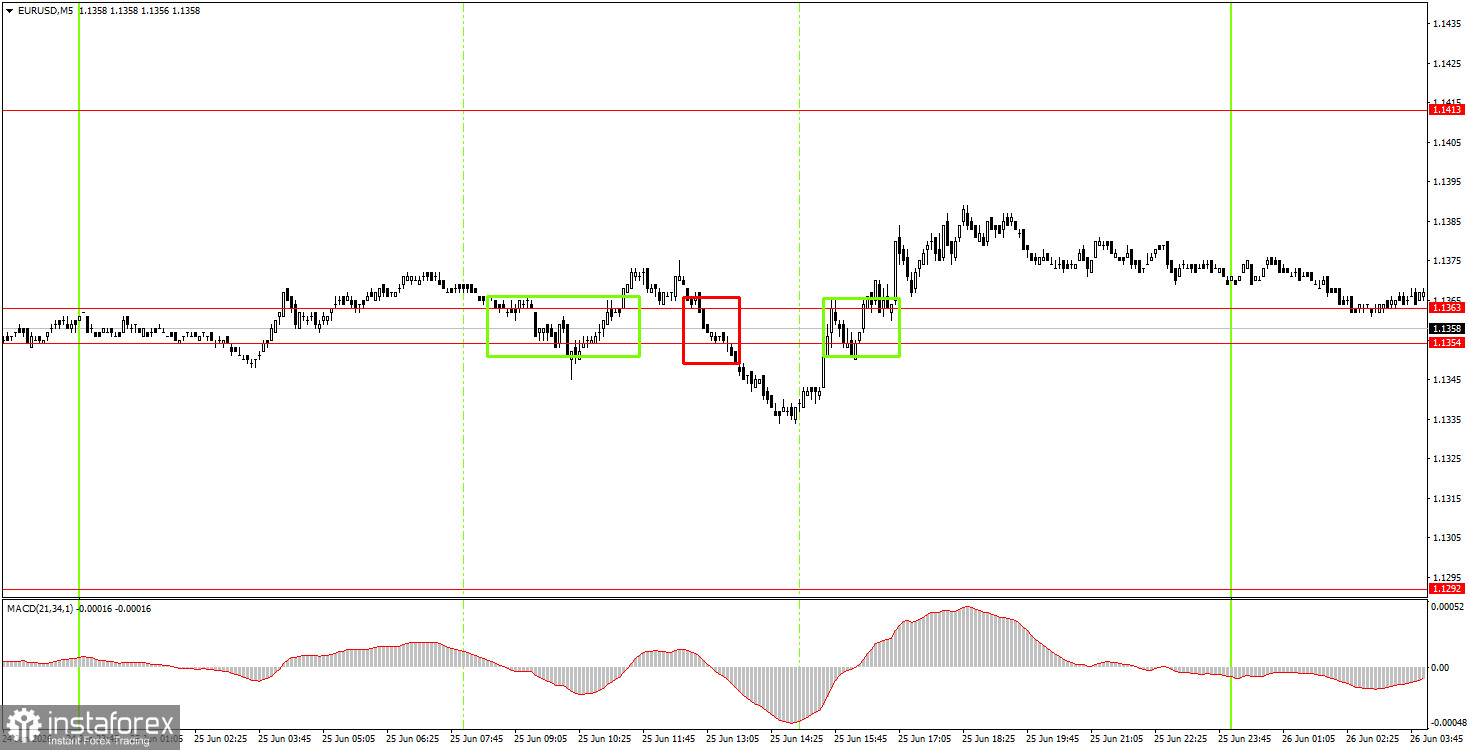
On the 5-minute timeframe, three trading signals were formed on Thursday, none of which yielded profit for traders. The price changed direction throughout the day, paying no attention to technical levels. Thus, novice traders could have acted on the first two signals, and afterward, it would have been advisable to cease trading.
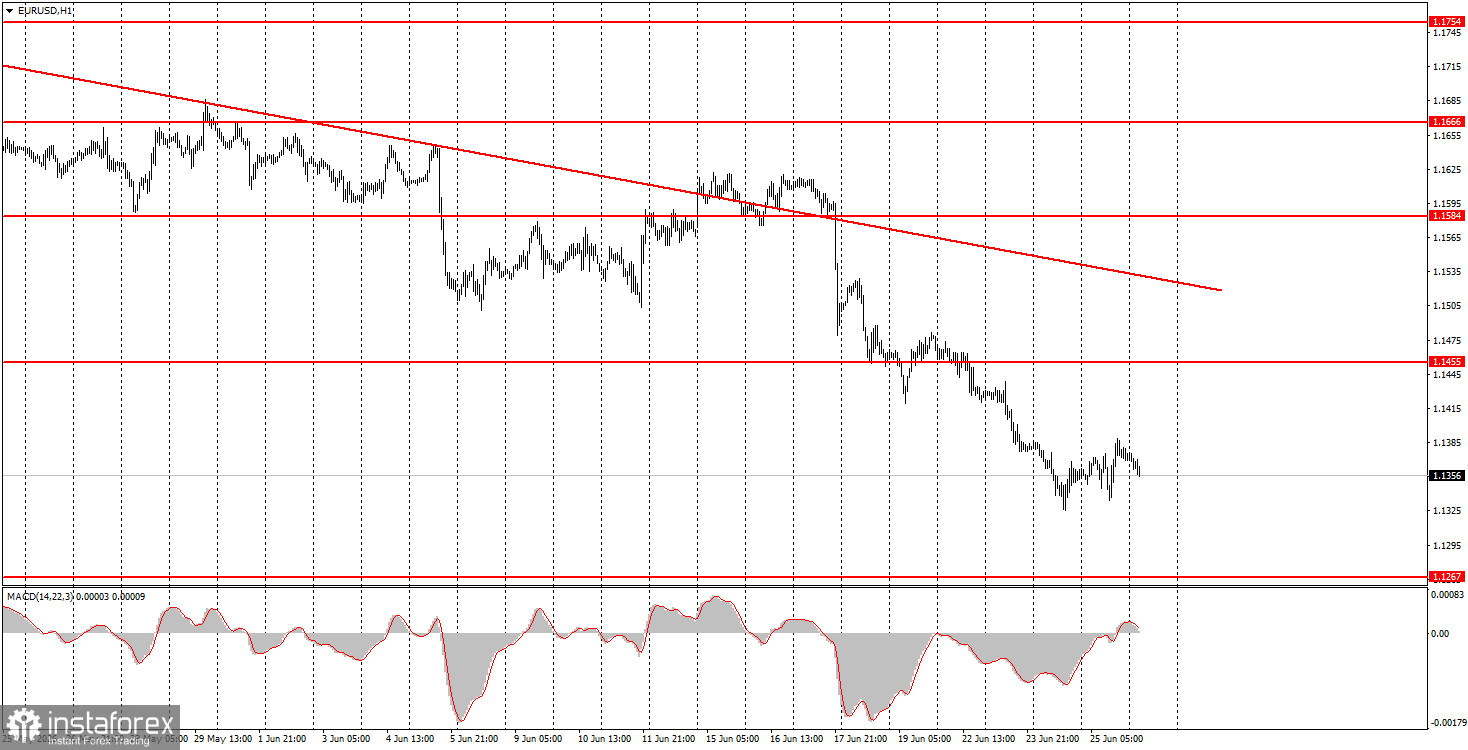
On the hourly timeframe, the downward trend continues, despite the breach of the trend line last week. As the deal between Iran and the U.S. is signed, the market has one less reason to buy the American currency. However, the market pays no attention to this fact and generally ignores almost all factors in favor of the euro. Thus, the current strengthening of the American currency lacks concrete reasons.
On Friday, novice traders may open short positions with targets of 1.1275-1.1292 if the price consolidates below the 1.1354-1.1363 area. Long positions can be opened targeting 1.1413 if the price solidifies above the 1.1354-1.1363 area. However, volatility may again be low, a factor to take into account.
On the 5-minute timeframe, the levels to consider are 1.1292, 1.1354-1.1363, 1.1413, 1.1455-1.1474, 1.1527-1.1531, 1.1584-1.1594, 1.1655-1.1666, 1.1745-1.1754, and 1.1830-1.1837. There are no significant events or reports scheduled in the Eurozone on Friday, while the U.S. will release only the University of Michigan consumer sentiment index, which is unlikely to provoke a strong, logical market reaction.
Price levels (areas) of support and resistance are targets when opening long or short positions or sources of signals.
Red lines indicate channels or trend lines that display the current trend and indicate the preferred direction for trading.
The MACD indicator (14,22,3) – histogram and signal line – is a supplementary indicator that can also be used as a source of signals.
Important speeches and reports (contained in the news calendar) can significantly impact the movement of the currency pair. Therefore, during their release, trading should be conducted with maximum caution, or one should exit the market to avoid sharp reversals against preceding movements.
Beginners trading in the forex market should remember that not every trade can be profitable. Developing a clear strategy and practicing money management are key to long-term success in trading.
Le recensioni analitiche di InstaForex ti renderanno pienamente consapevole delle tendenze del mercato! Essendo un cliente InstaForex, ti viene fornito un gran numero di servizi gratuiti per il trading efficiente.


