 Rimani
Condizioni di trading
Strumenti


The GBP/USD currency pair also attempted to start an upward movement on Friday, but little came of it. The British pound and the euro are currently extremely weak, and the reasons remain unknown or at least ambiguous. We still doubt that the recent rise of the US dollar was triggered by Keir Starmer's resignation or the tightening of the Federal Reserve's monetary policy. Moreover, it is unlikely to have been provoked by geopolitics, as Iran and the US have signed a memorandum of understanding. Thus, the US dollar should have declined due to this factor. Perhaps most retail traders simply do not have the information available to market makers, but based on the pair's movements and market actions, it can be confidently stated that no one is interested in the pound right now. Therefore, it cannot even correct itself. As for the conflict in the Middle East, it could flare up again at any moment. Military actions have already resumed, although both sides formally remain under a ceasefire.
Technically, the price is above the 1.3179-1.3187 range, which can be considered support for the British currency. Another failure below this area could send the pound into a new free fall. Above the critical line, there are certain chances for an upward correction targeting the Senkou Span B line. There is currently no trend line, as the movement is choppy and lacks a clearly defined second extreme. The only positive point for the pound is the upward trend on the weekly timeframe.
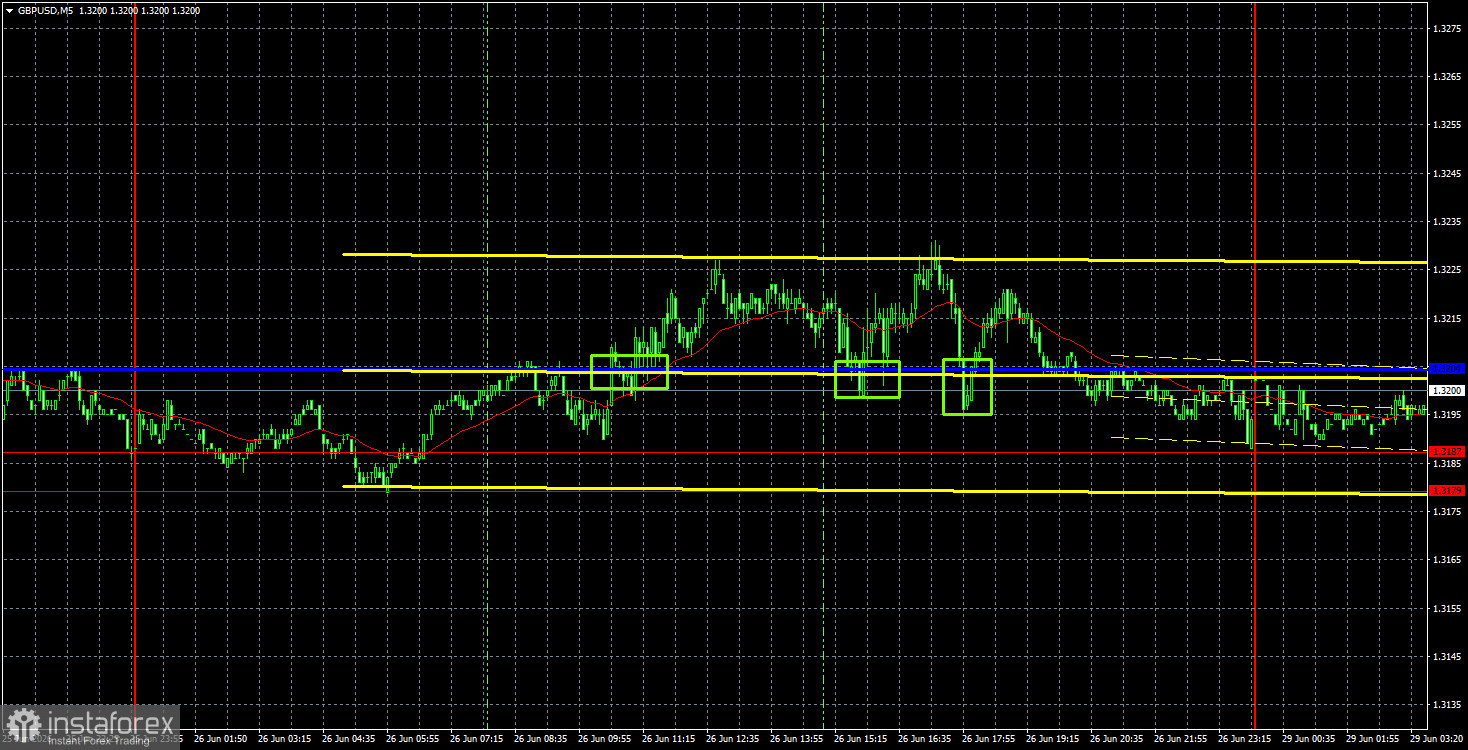
In the 5-minute timeframe, three buy signals were generated on Friday due to the Kijun-sen line and the 1.3179-1.3187 range. However, the price bounced off this area three times but failed to show any increase. Market volatility is decreasing again.
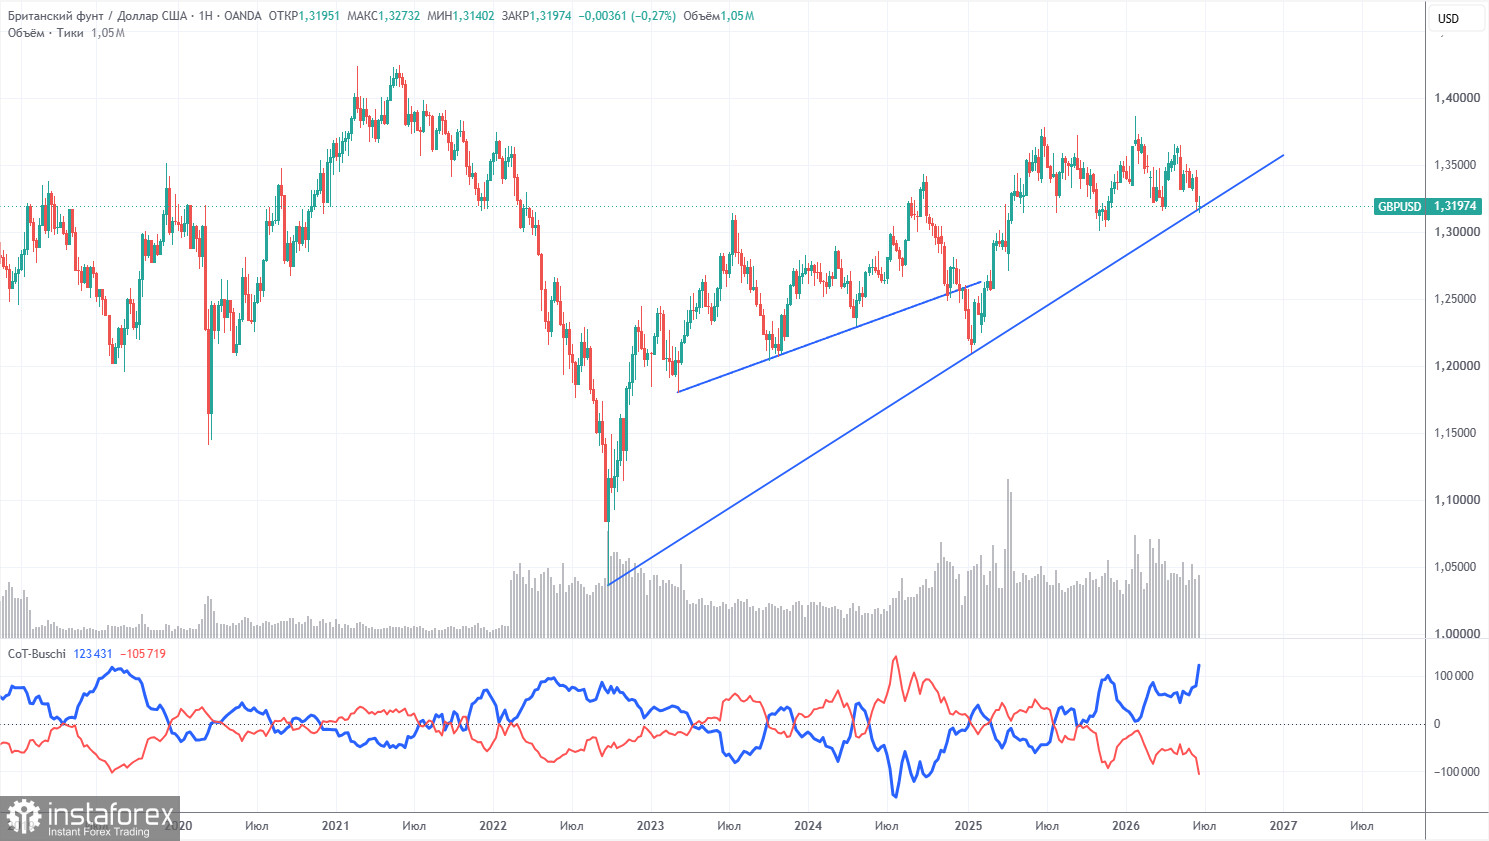
COT reports for the British pound show that in recent years, the sentiment among commercial traders has been constantly changing. The red and blue lines, representing the net positions of commercial and non-commercial traders, frequently cross each other and are mostly close to the zero mark. Currently, the lines are distancing from each other, with non-commercial traders still dominating with... sales. Given the events in the Middle East, it is not surprising that demand for riskier currencies is low.
In the long term, the dollar continues to decline due to Donald Trump's policies, as can be clearly seen on the weekly timeframe (illustration above). The trade war will continue in one form or another for a long time, and Trump's policies are aimed, directly and indirectly, at weakening the US currency. However, at present, geopolitical factors remain paramount, significantly supporting the dollar in 2026. Since the conflict in the Middle East is not yet resolved, the US dollar may still see further growth. According to the latest COT report (dated June 23), the "Non-commercial" group closed 1,300 BUY contracts and opened 32,900 SELL contracts. Thus, the net position of non-commercial traders decreased by another 31,600 contracts over the week.
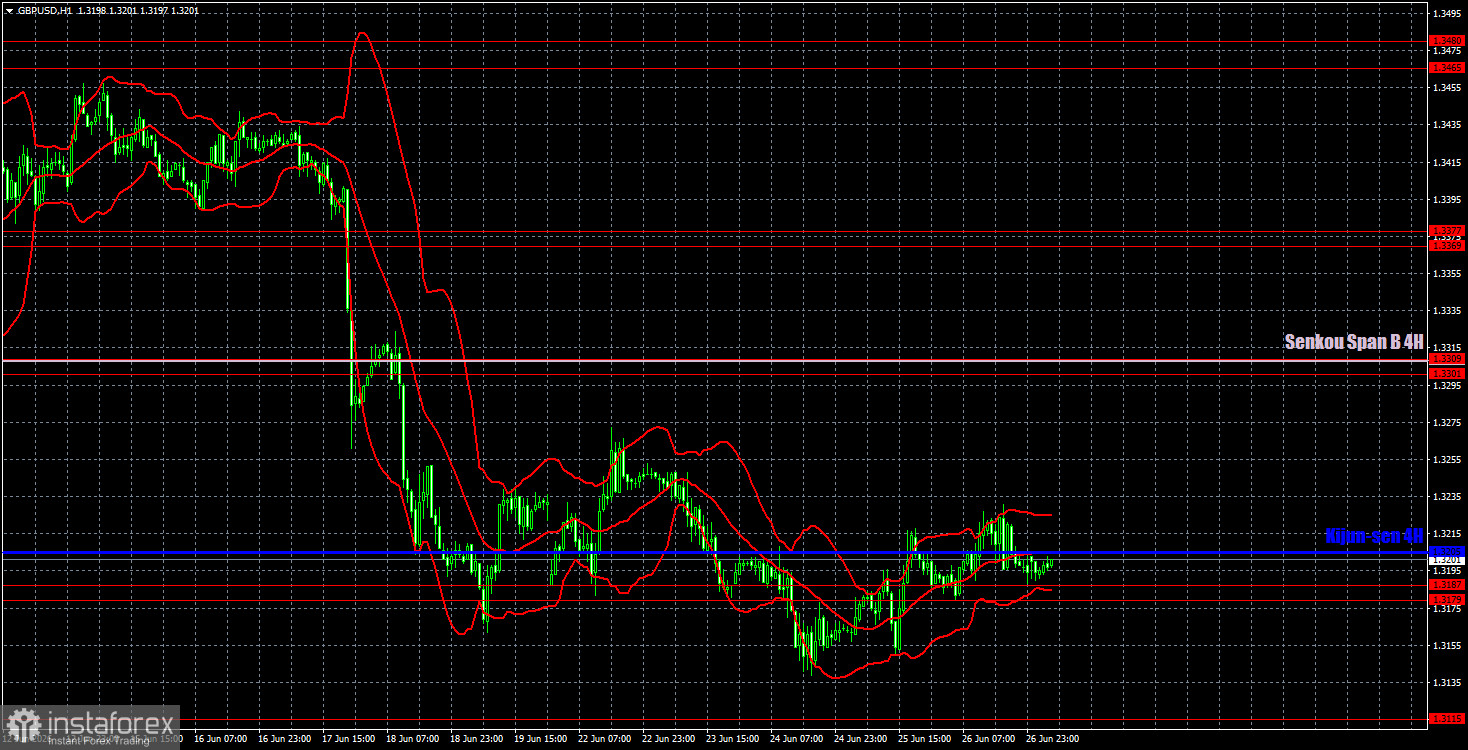
On the hourly timeframe, the GBP/USD pair continues its downward trend, which does not correspond to the local fundamental and geopolitical backdrop. However, the market has ignored both fundamental and macroeconomic factors for three months and is now ignoring both geopolitics and selectively working with factors. We do not believe that the recent decline of the British currency is justified, but the technical picture clearly indicates a downward trend.
For June 29, we highlight the following important levels: 1.3042-1.3050, 1.3096-1.3115, 1.3179-1.3187, 1.3301-1.3309, 1.3369-1.3377, 1.3465-1.3480, 1.3588, 1.3671-1.3681. The Senkou Span B (1.3310) and Kijun-sen (1.3205) lines can also serve as signal sources. It is recommended to set the Stop Loss level to break even when the price moves in the correct direction by 20 pips. The Ichimoku indicator lines may move throughout the day, which should be taken into account when determining trading signals.
On Monday, there are no important reports or events scheduled in the UK and the US. Volatility has recently decreased significantly, but the British pound is unable to fully correct even after a sharp decline. We believe that this week the pair will continue to attempt a slight rise.
Today, traders may consider short positions targeting 1.3096-1.3115 if the pair settles below the 1.3179-1.3187 range. Long positions remain relevant if the price is above the critical line and the 1.3179-1.3187 area, targeting 1.3301-1.3309.
Price support and resistance levels (resistance/support) are thick red lines around which movement may end. They are not sources of trading signals.
Kijun-sen and Senkou Span B lines are Ichimoku indicator lines transferred to the hourly timeframe from the 4-hour timeframe. They are strong lines.
Extreme levels are thin red lines from which the price has previously bounced. They are sources of trading signals.
Yellow lines are trend lines, trend channels, and any other technical patterns.
Indicator 1 on COT charts shows the size of the net position for each category of traders.
Le recensioni analitiche di InstaForex ti renderanno pienamente consapevole delle tendenze del mercato! Essendo un cliente InstaForex, ti viene fornito un gran numero di servizi gratuiti per il trading efficiente.


