 Rimani
Condizioni di trading
Strumenti



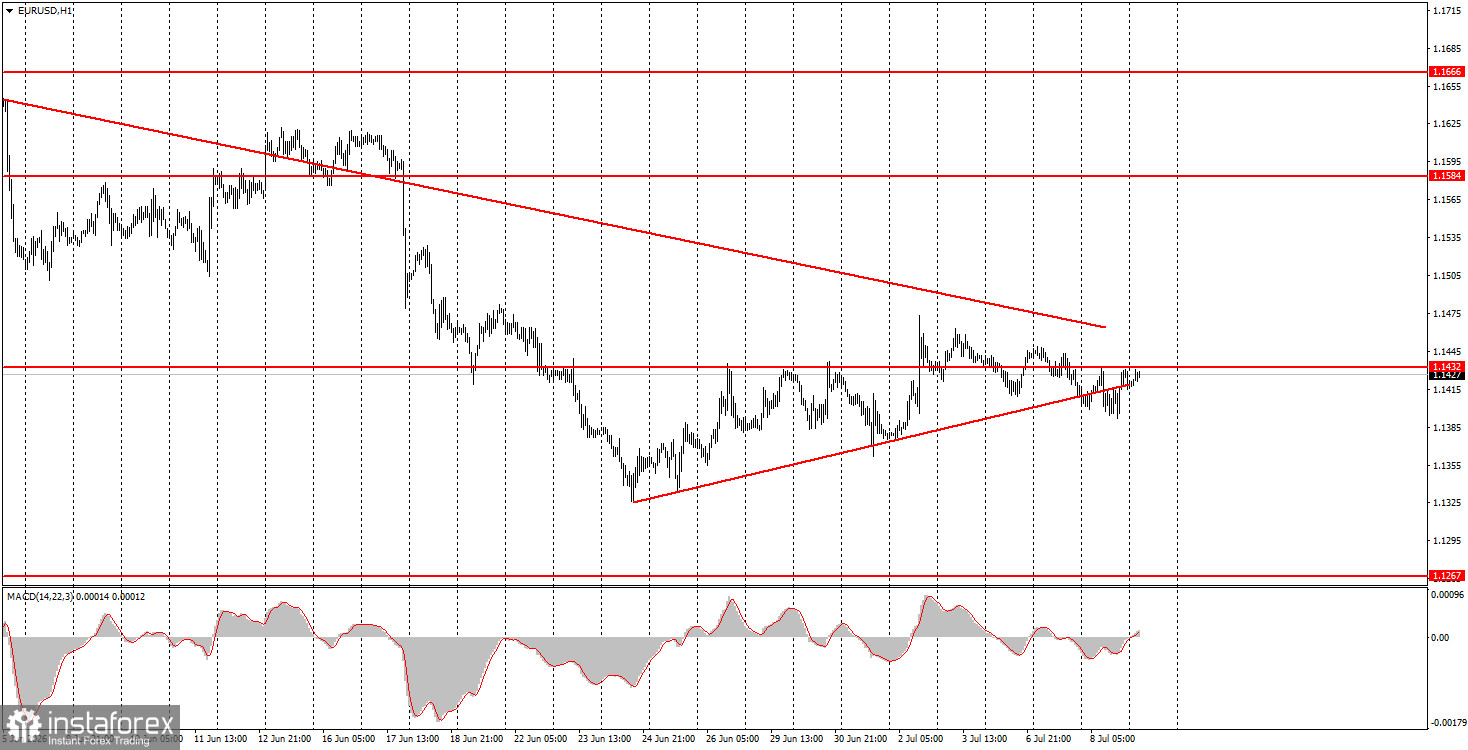
The EUR/USD currency pair showed a complete unwillingness to move in any direction during trading on Wednesday. Neither geopolitical factors nor the Federal Reserve's minutes were able to provoke movements of more than 20 pips. We believe that the market's reaction was virtually absent to all the day's events, as it is extremely difficult to determine a response to any event with a total movement of less than 40 pips. In other words, 40 pips of daily volatility is ordinary "market noise." The absence of a trending movement indicates a flat. Nevertheless, the situation in the Middle East escalated again yesterday; further negotiations are once again under threat of collapse; oil prices rose by almost $10, and the Strait of Hormuz may soon be blocked again. Thus, there are formal reasons for the market to buy dollars again. However, we believe that the geopolitical factor has already been priced in, as has the possible rate hike by the Fed. The dollar may continue to rise only due to inertia and technical factors.
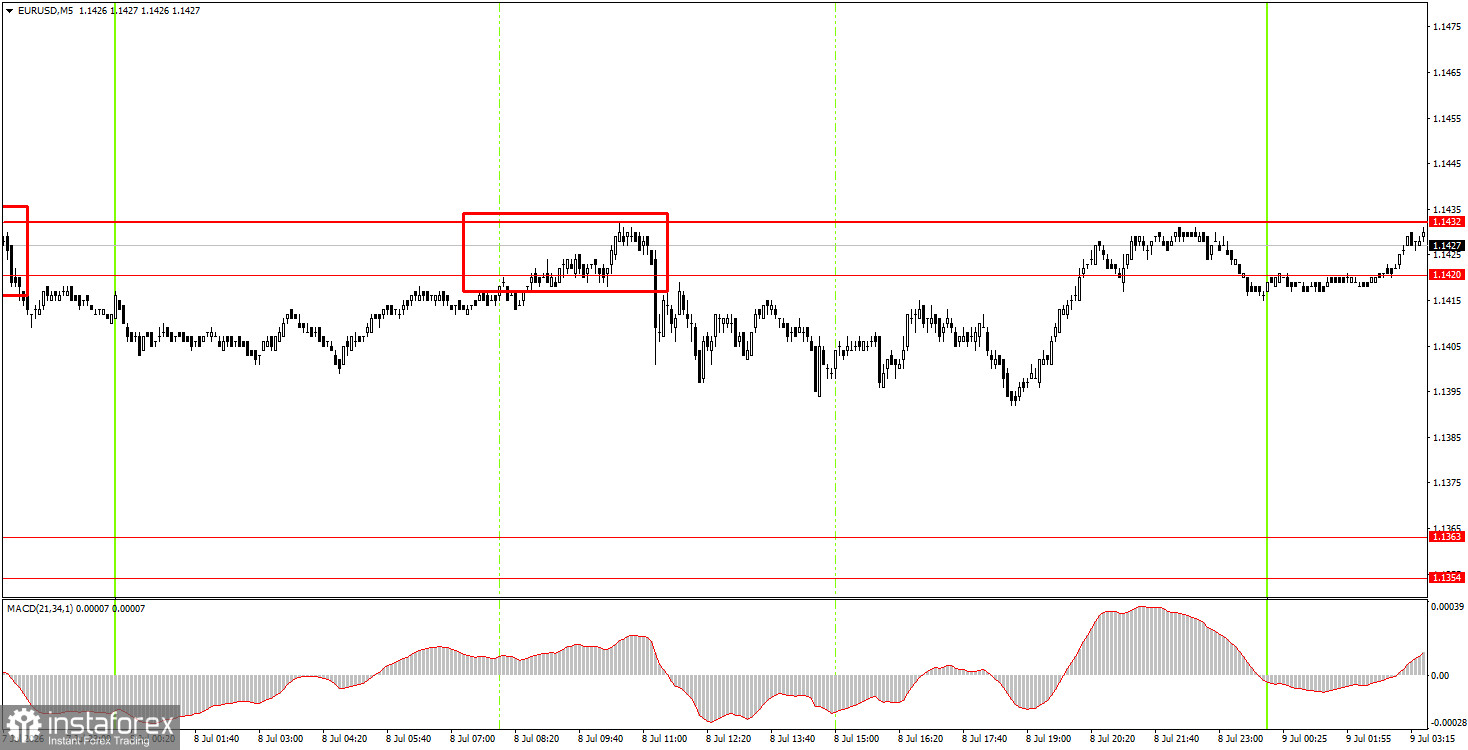
On the 5-minute timeframe, one sell signal was formed on Wednesday. During the European trading session, the price bounced from the 1.1420-1.1432 area, allowing novice traders to open short positions. After the signal was formed, the pair moved down by about 15 pips. By the evening, it returned to its starting position.
On the hourly timeframe, the two-month downward trend persists, and in recent weeks we have seen only a weak upward correction. Technically, the dollar has every chance of resuming growth. We do not see fundamental, macroeconomic, or geopolitical reasons for its strengthening after two months of growth. However, the trend persists, and the correction could end at any moment.
On Thursday, novice traders can open short positions targeting 1.1354-1.1363 if the price bounces from the 1.1420-1.1432 area. Long positions can be opened targeting 1.1527-1.1531 if the pair exceeds the 1.1420-1.1432 area.
On the 5-minute timeframe, levels to be considered are 1.1292, 1.1354-1.1363, 1.1420-1.1432, 1.1527-1.1531, 1.1584-1.1594, 1.1655-1.1666, 1.1745-1.1754, 1.1830-1.1837. On Thursday, no important events or publications are scheduled in either the US or the European Union. A few secondary reports in Germany and America are likely to be ignored. The market paid no attention to geopolitical factors yesterday.
Price levels (areas) of support and resistance are targets when opening long or short positions or sources of signals.
Red lines indicate channels or trend lines that display the current trend and indicate the preferred direction for trading.
The MACD indicator (14,22,3) – histogram and signal line – is a supplementary indicator that can also be used as a source of signals.
Important speeches and reports (contained in the news calendar) can significantly impact the movement of the currency pair. Therefore, during their release, trading should be conducted with maximum caution, or one should exit the market to avoid sharp reversals against preceding movements.
Beginners trading in the forex market should remember that not every trade can be profitable. Developing a clear strategy and practicing money management are key to long-term success in trading.
Le recensioni analitiche di InstaForex ti renderanno pienamente consapevole delle tendenze del mercato! Essendo un cliente InstaForex, ti viene fornito un gran numero di servizi gratuiti per il trading efficiente.


